


NASDAQ 100 Reaches Historic High. META Shares May Surpass the Historical High
FXOpen

The American stock index NASDAQ 100 has set a new historical high, surpassing the psychological mark of 17,000 points.
The growth was attributed to:
→ Analysts at Bank of America raising the rating of AAPL stocks, recommending them for BUY. The price of AAPL shares rose by almost 4%.
→ The growth of AMD and NVDA stock prices, as chip manufacturers are significant beneficiaries due to the widespread adoption of AI.
→ The earnings season gaining momentum. Market participants anticipate strong results from major technology companies (MSFT, GOOGL, NVDA, and others).
Note the movement of META stock price – the social media giant is close to reclaiming a $1 trillion market capitalisation.
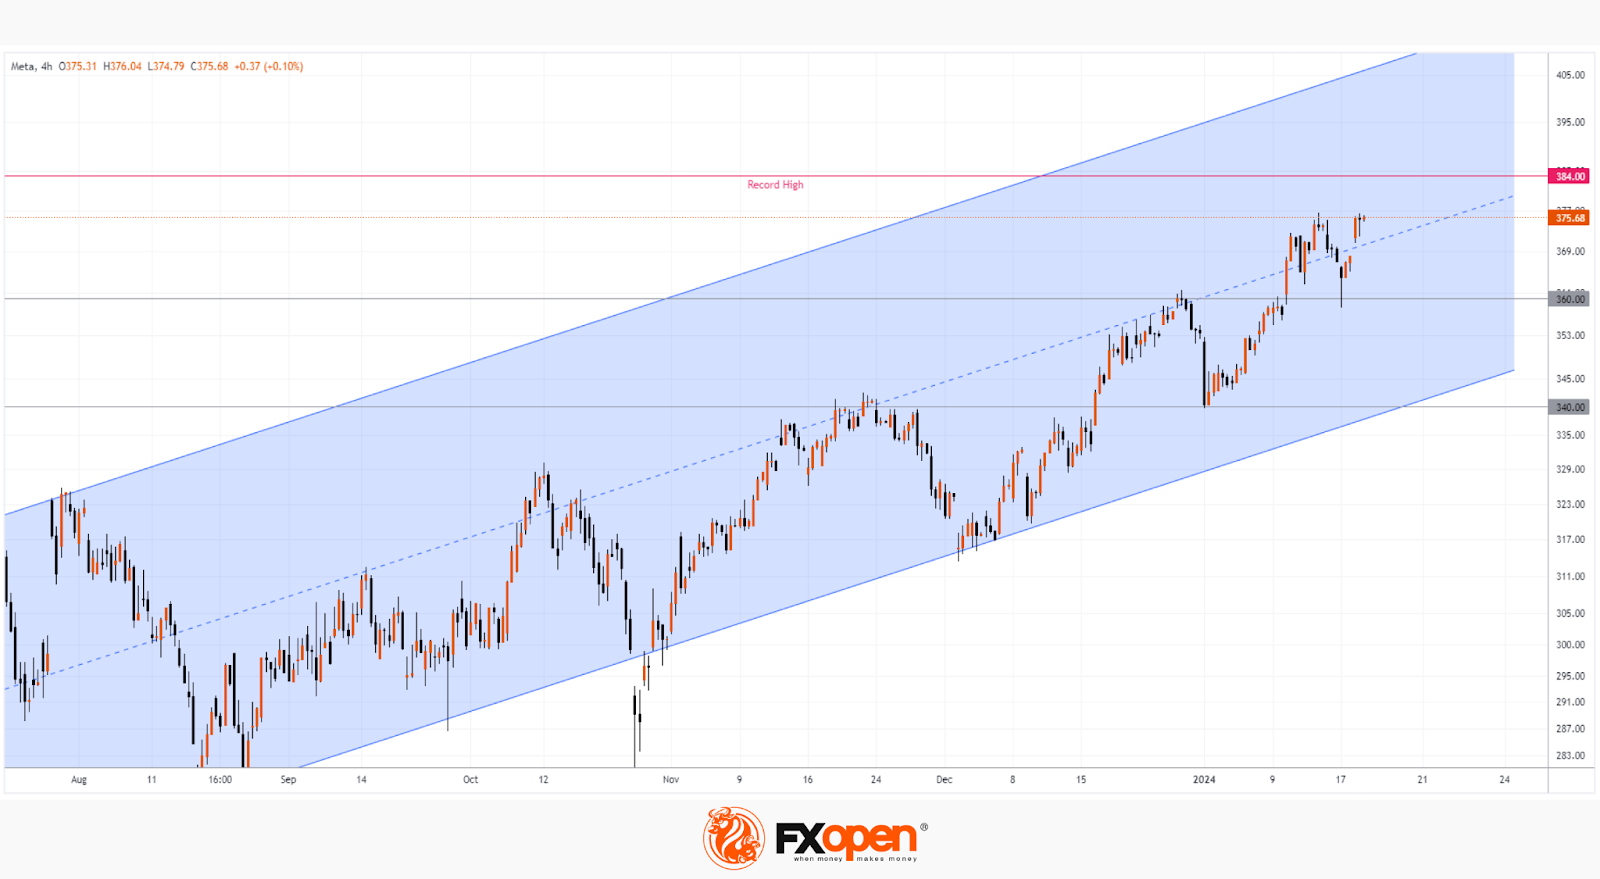
The META stock price chart shows that:
→ The market is in an upward trend (indicated by the blue channel). The price is above the median line, a sign of demand stability.
→ The level at $340 has shifted its role from resistance to support. A similar phenomenon is observed at the $360 level.
Mark Zuckerberg announced yesterday that by the end of 2024, the company's computing infrastructure would include 350,000 nVidia H100 graphics cards (designed for AI, costing between $25k and $40k each, according to CNBC).
It is not ruled out that riding on the positive momentum, the price of META shares may surpass the historical high. The publication of META's Q4 2023 performance report is scheduled for February 1, 2024.
Buy and sell stocks of the world's biggest publicly-listed companies with CFDs on FXOpen’s trading platform. Open your FXOpen account now or learn more about trading share CFDs with FXOpen.
Trade global index CFDs with zero commission and tight spreads (additional fees may apply). Open your FXOpen account now or learn more about trading index CFDs with FXOpen.
This article represents the opinion of the Companies operating under the FXOpen brand only. It is not to be construed as an offer, solicitation, or recommendation with respect to products and services provided by the Companies operating under the FXOpen brand, nor is it to be considered financial advice.
Stay ahead of the market!
Subscribe now to our mailing list and receive the latest market news and insights delivered directly to your inbox.


Latest articles

Brent Crude Oil: From Ceasefire to Crossfire — What's Next?
Just weeks ago, traders were pricing in peace. Now they're pricing in war again—and that reversal says everything about how fragile the current Middle East calm really is.
Brent crude has surged to $86 a barrel, its highest level

AUD/USD and USD/CAD React to Softer US Inflation
Commodity-linked currencies strengthened after US inflation data came in weaker than expected. The Consumer Price Index (CPI) slowed to 3.5% year-on-year in June, below the 3.8% forecast, while core inflation eased to 2.6% versus expectations of 2.
NVIDIA: Kyber NVL144 Dispute Weighs on the Stock
NVIDIA shares found themselves at the centre of debate over the future of the Kyber NVL144 system. On 6 July, CNBC, citing research firm SemiAnalysis, reported that the project could be delayed by more than a year—from 2027 to