


Nasdaq 100 Under Pressure
FXOpen

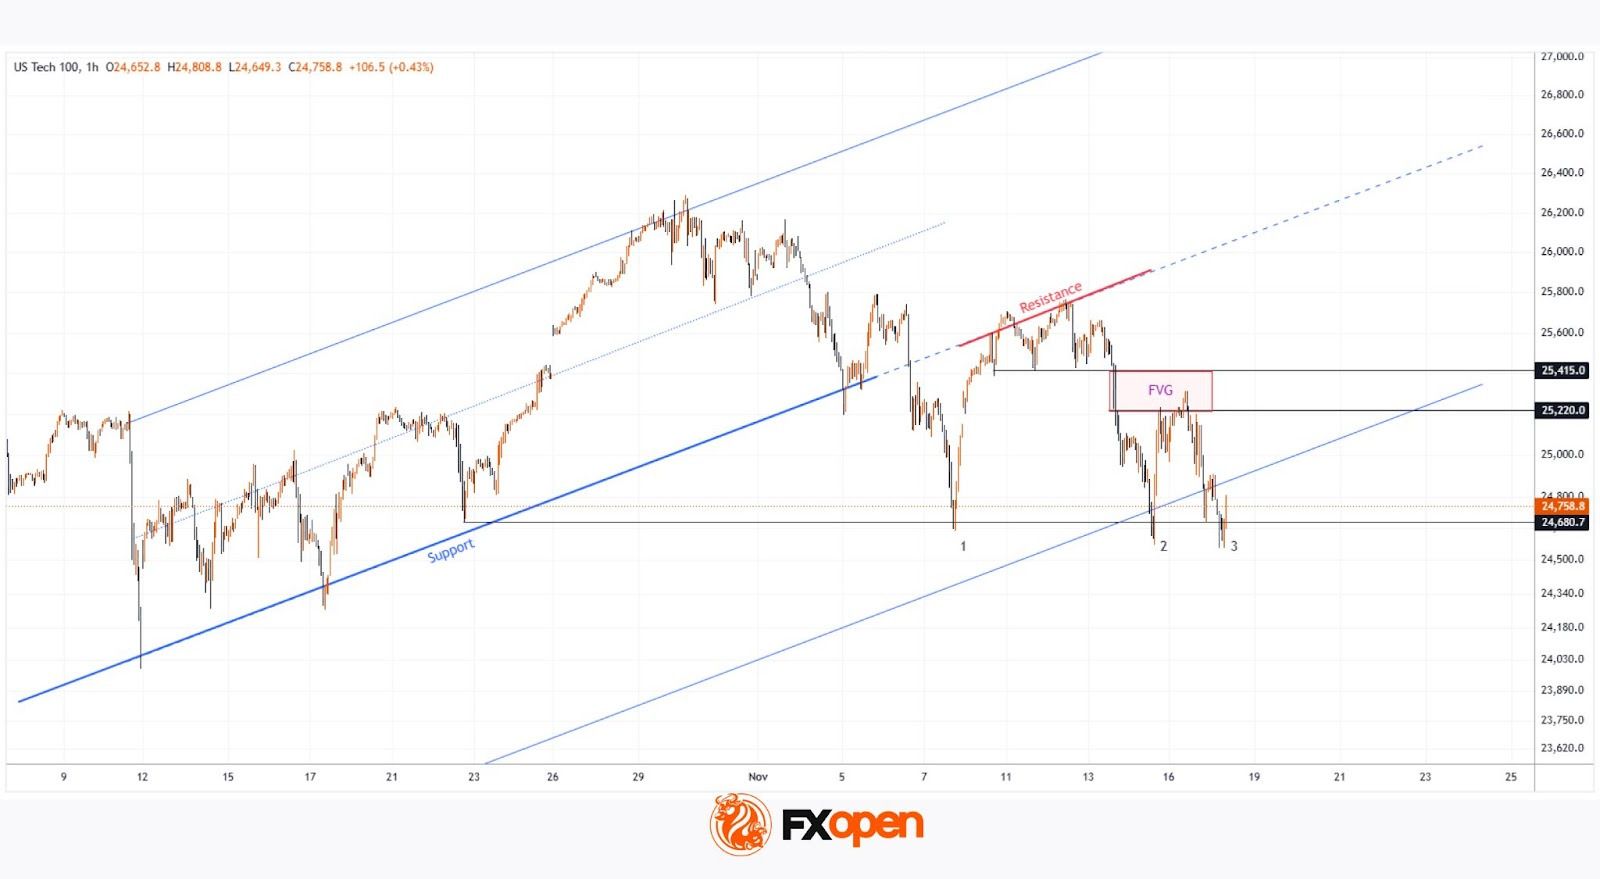
As the chart shows, the Nasdaq 100 index (US Tech 100 mini on FXOpen) fell today (point 3) to its lowest level in a month, making it the weakest performer among the major US indices. The sell-off in the technology sector has been driven by a double blow:
→ A reassessment of expectations for the Federal Reserve’s next rate move. According to market observers, the probability of a Fed rate cut on 10 December continues to decline and now stands at 43%, compared with 62% a week earlier.
→ Growing scepticism about the valuations of companies linked to artificial intelligence. A Bank of America fund managers’ survey revealed heavy overcrowding in tech: 54% cited “long Magnificent 7” as the most crowded trade, while 45% viewed an AI bubble as the biggest tail risk.
Technical Analysis of the Nasdaq 100 Chart
When analysing the hourly chart of the Nasdaq 100 (US Tech 100 mini on FXOpen) on 10 November, we identified an ascending channel. However, mounting selling pressure has resulted in:
→ the channel being extended downwards;
→ its former lower boundary (which acted as support) now acting as the median line and serving as resistance.
From the demand perspective:
→ The lower boundary of the expanded channel may prevent a deeper bearish move.
→ The chart shows a sequence of false bearish breakouts (1–2–3), where the price dips slightly below the previous low only to reverse sharply upward — signs of a Liquidity Grab pattern that may indicate buyer aggression.
From the supply perspective:
→ The 25220–25415 zone appears to be a confirmed FVG area, where a clear market imbalance emerged and sellers strongly dominated.
Bulls may attempt to push the Nasdaq 100 (US Tech 100 mini on FXOpen) back into the ascending channel, but whether this scenario plays out will largely depend on Nvidia’s quarterly earnings report — a key event for the technology sector, scheduled for release tomorrow.
Trade global index CFDs with zero commission and tight spreads (additional fees may apply). Open your FXOpen account now or learn more about trading index CFDs with FXOpen.
This article represents the opinion of the Companies operating under the FXOpen brand only. It is not to be construed as an offer, solicitation, or recommendation with respect to products and services provided by the Companies operating under the FXOpen brand, nor is it to be considered financial advice.
Stay ahead of the market!
Subscribe now to our mailing list and receive the latest market news and insights delivered directly to your inbox.


Latest articles

CAD/JPY: The Yen's Most Historic Move in 30 Years Meets a Fragile Support
Two central banks are heading in genuinely opposite directions this week, and the tension is unmistakable. The Bank of Canada held rates steady at 2.25% on September 2, with a mildly hawkish tilt as policymakers acknowledged a broadening economic

USD/JPY and USD/CAD Await Key Fed Decision
The US dollar is consolidating against the yen and Canadian dollar ahead of the key event of the week — the Federal Reserve meeting. The Fed is widely expected to raise its policy rate by 25 basis points to a range

UnitedHealth: Fundamentals Are Healing, Now the Chart Must Agree
UnitedHealth finds itself in a genuinely split narrative right now, trading near $388, down about 15.9% from its 52-week high, even as the fundamental picture keeps improving. Q2 earnings beat expectations, with revenue of $112.03 billion, and the