


Natural Gas Price Drops by 7%
FXOpen

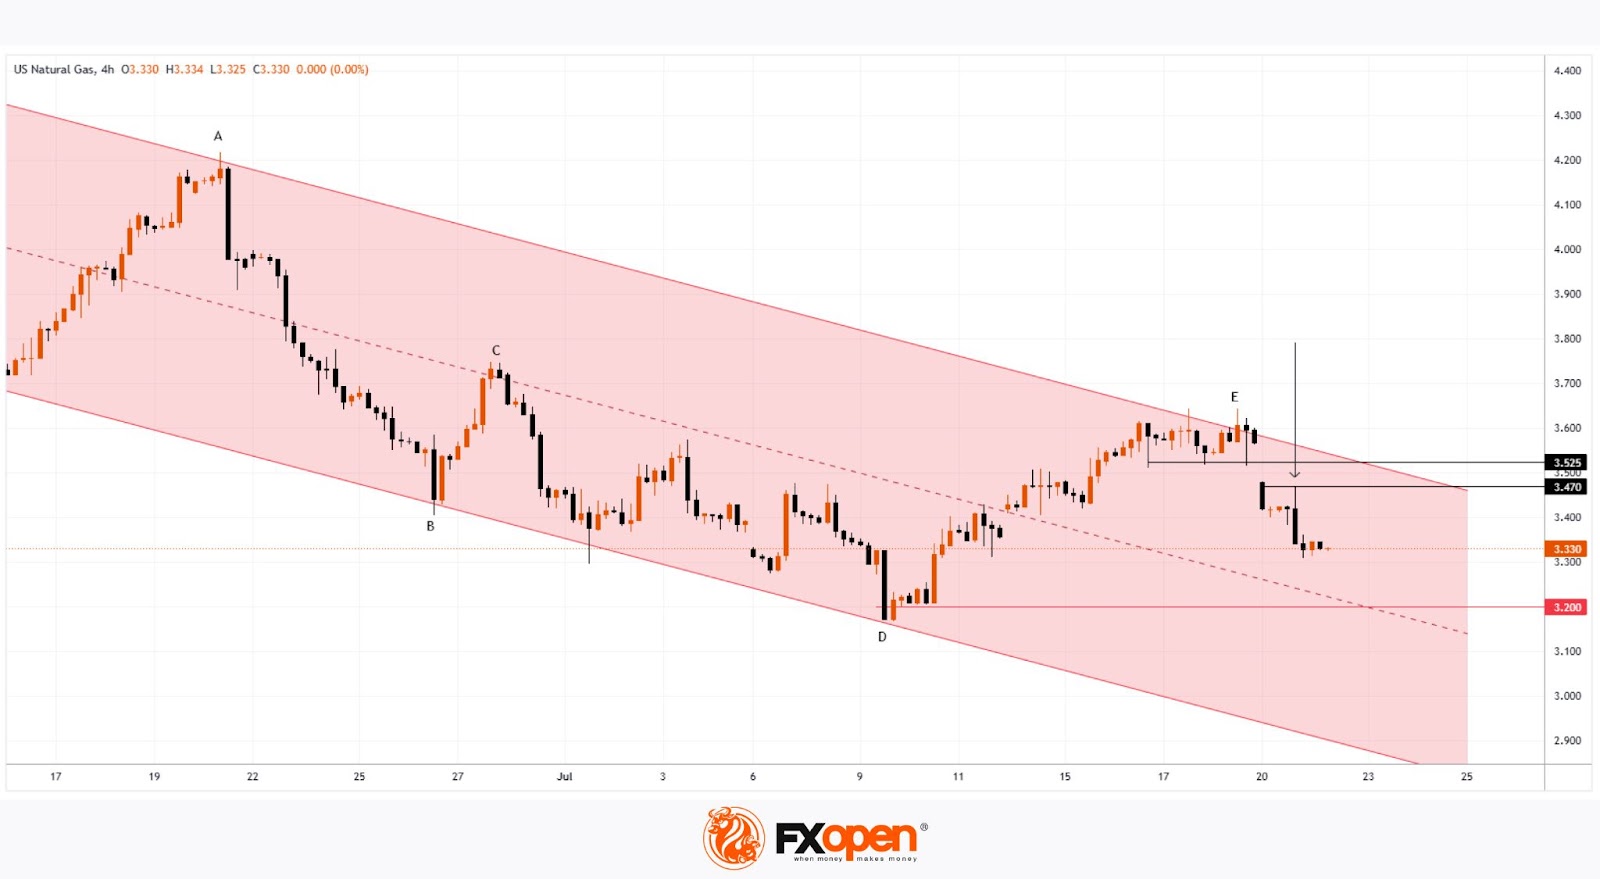
As the XNG/USD chart shows today, natural gas is trading around $3.333/MMBtu, although yesterday morning the price was approximately 7% higher.
According to Reuters, the decline in gas prices is driven by:
→ Record-high production levels. LSEG reported that average gas output in the Lower 48 rose to 107.2 billion cubic feet per day so far in July, surpassing the previous monthly record of 106.4 billion cubic feet per day set in June.
→ Favourable weather forecasts. Although the peak of summer heat is still anticipated, forecasts indicate that temperatures over the next two weeks may be lower than previously expected.
As a result, today’s XNG/USD chart appears bearish.
Technical Analysis of the XNG/USD Chart
The chart indicates that since mid-May, natural gas prices have been fluctuating within a descending channel (marked in red), with July’s peak (E) highlighting the upper boundary of the pattern.
A key resistance area is now represented by a bearish gap, formed between:
→ the former support level at $3.525;
→ the $3.470 level – which, as the arrow suggests, is already showing signs of acting as resistance.
Under these conditions, it is reasonable to assume that the price may continue forming a downward market structure A-B-C-D-E, consisting of lower highs and lows, potentially moving towards the channel’s median – which approximately corresponds to July’s low (around the $3.200 level).
Start trading commodity CFDs with tight spreads (additional fees may apply). Open your trading account now or learn more about trading commodity CFDs with FXOpen.
This article represents the opinion of the Companies operating under the FXOpen brand only. It is not to be construed as an offer, solicitation, or recommendation with respect to products and services provided by the Companies operating under the FXOpen brand, nor is it to be considered financial advice.
Stay ahead of the market!
Subscribe now to our mailing list and receive the latest market news and insights delivered directly to your inbox.


Latest articles

Nasdaq 100: 48 Hours of Chaos, One Trendline Standing in the Way
Wall Street just lived through one of its wildest 48 hours of the year. On Wednesday, the Fed held rates steady at 3.50%-3.75%, but three FOMC members broke ranks to demand a hike—an unusually hawkish dissent

Amazon Analysis: Strong Earnings Coincide with a Breakout from the Correction
On 30 July, Amazon.com reported its financial results for the second quarter of 2026, significantly exceeding market expectations. Revenue rose 20% year-on-year to $200.6 billion, compared with the consensus forecast of around $196.5 billion. The main growth

GBP/USD and EUR/GBP Await Key Bank of England Decision
The pound strengthened following the outcome of the US Federal Reserve meeting, where the central bank, as expected, kept interest rates unchanged. However, the Fed did not provide the market with clear signals of an imminent shift towards rate cuts,