


FXOpen
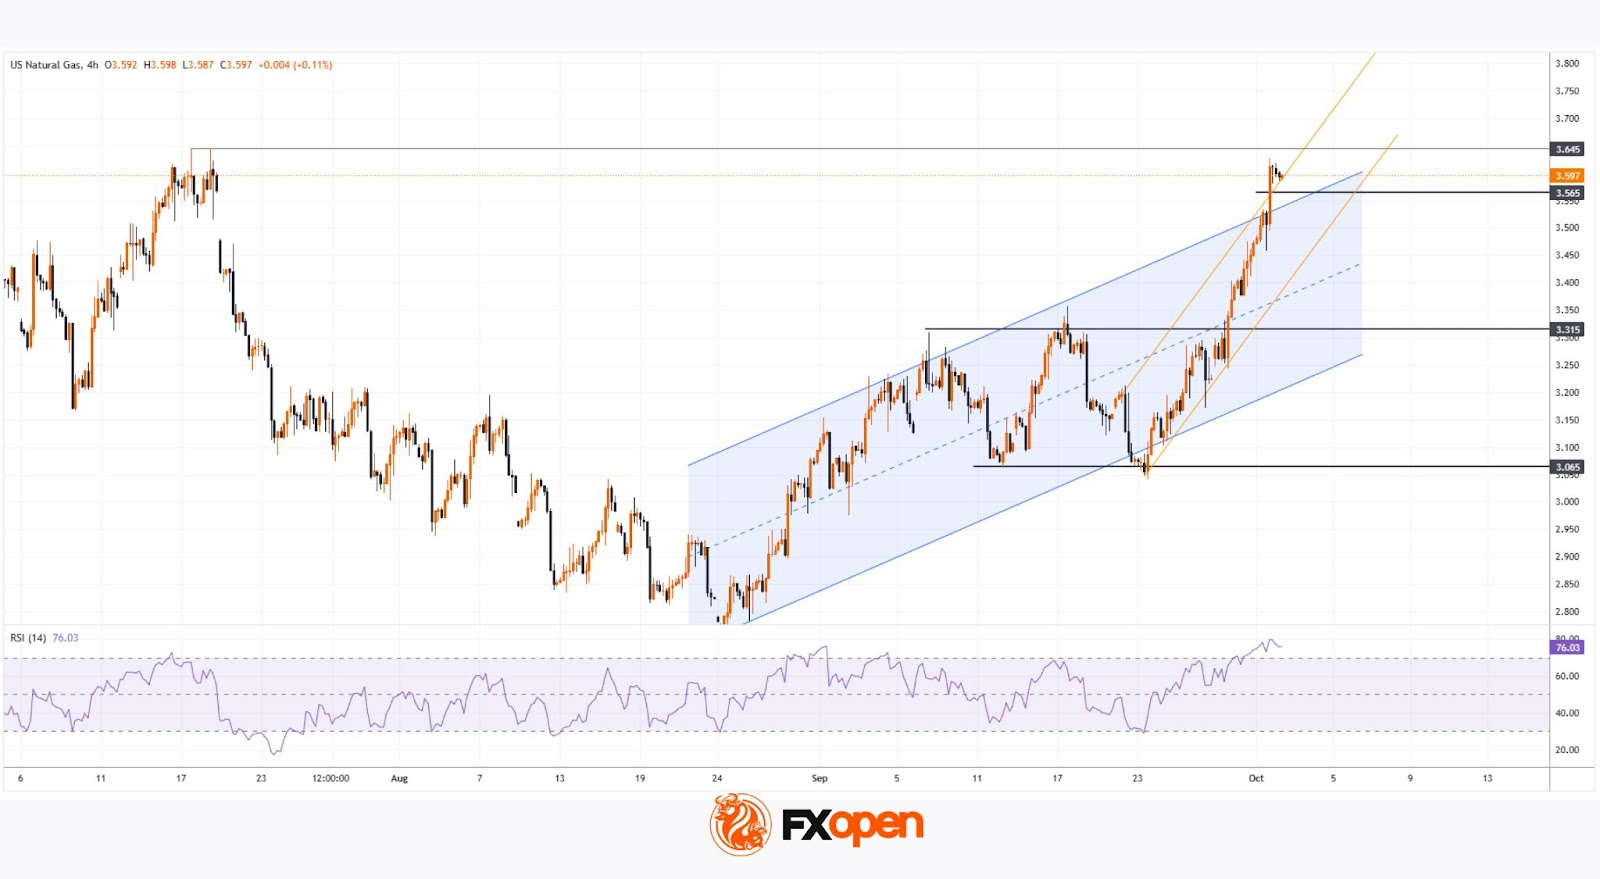
As the XNG/USD chart shows today, natural gas prices have risen above $3.600/MMBtu for the first time since mid-July.
According to media reports, the rise in gas prices has been driven by:
→ Weather models forecasting colder conditions, suggesting the heating season may begin earlier than expected;
→ An EBW Analytics Group note highlighting short-covering activity in the market, which has accelerated the rally (a short squeeze effect).
At the same time, chart analysis suggests that the upside potential may be limited.
Technical Analysis of the XNG/USD Chart
Three factors might restrict further price growth:
→ The RSI indicator signals extreme overbought conditions.
→ Price has moved above the upper boundary of the channel (which has been in place since August), indicating that natural gas may be overvalued.
→ If we view September’s moves as a 3.065–3.315 range, then the target following the breakout on 29 September should be calculated based on the range height — pointing to 3.645. This target has already been reached.
Thus, we could assume that the market is vulnerable to a pullback (for example, towards the median of the blue channel). At the same time, the steep upward trajectory (highlighted in orange) remains intact.
Therefore, we may see an attempt at a bullish breakout of the July high near the 3.65 level — although, given the factors mentioned above, such a breakout could well prove to be a false one.
Start trading commodity CFDs with tight spreads (additional fees may apply). Open your trading account now or learn more about trading commodity CFDs with FXOpen.
This article represents the opinion of the Companies operating under the FXOpen brand only. It is not to be construed as an offer, solicitation, or recommendation with respect to products and services provided by the Companies operating under the FXOpen brand, nor is it to be considered financial advice.
Stay ahead of the market!
Subscribe now to our mailing list and receive the latest market news and insights delivered directly to your inbox.


Latest articles

Market Analysis: GBP/USD Dips Further As EUR/GBP Regains Traction
GBP/USD failed to climb above 1.3500 and corrected some gains. EUR/GBP started a decent increase and might aim for more gains above 0.8700.
Important Takeaways for GBP/USD and EUR/GBP Analysis Today
· The British Pound


Market Insights with Gary Thomson: Oil, US Retail Sales & NFP in Focus
In this video, we’ll explore the key economic events and market trends, shaping the financial landscape. Get ready for insights into financial markets to help you navigate the week ahead. Let’s dive in!
In this episode of Market