


FXOpen
As shown on the daily chart of Netflix (NFLX) shares, the price surpassed the July 19 peak around $677 on Friday but closed well below the day’s highs. Notably:
→ Since August 5, Netflix (NFLX) has outperformed stock indices;
→ The stock has risen by about 15% from the August 5 close.
Will the rally continue?
Bullish argument:
→ Analysts expect an improvement in the company’s fundamentals following enhancements to its business model. According to Zacks, Netflix might report earnings of $5.07 per share for the current quarter, representing a year-on-year increase of +35.9%. The Zacks consensus estimate has risen by +7.9% over the past 30 days.
Bearish argument:
According to SEC filings, Netflix’s Chief Legal Officer sold $7 million worth of shares. Could this sale be motivated by insider information that might lead to a decline in the stock price?
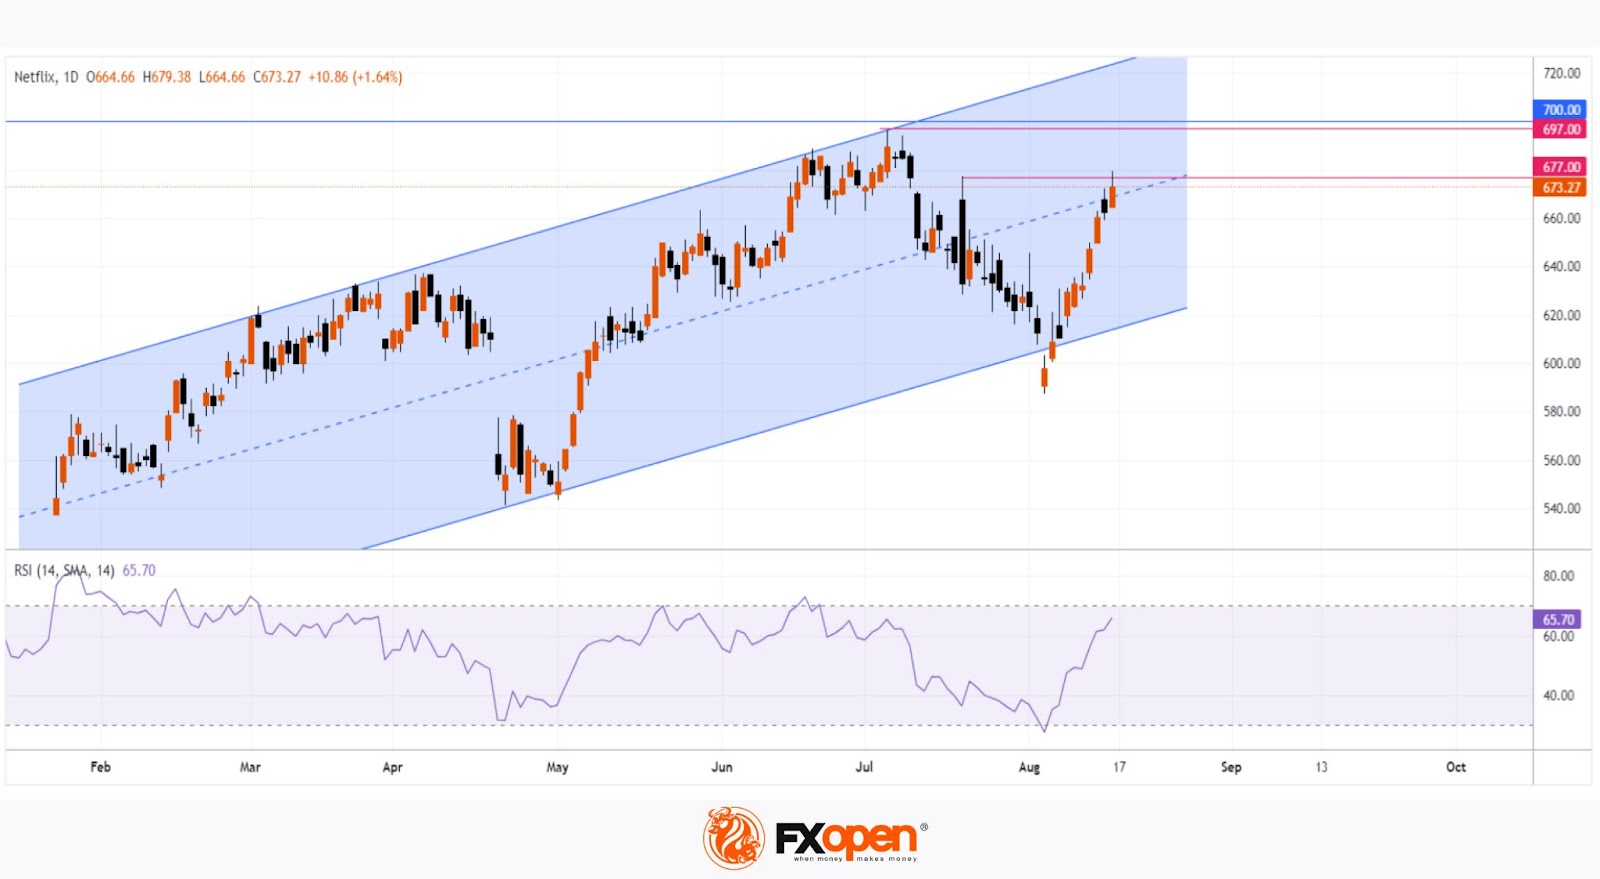
Technical analysis of the Netflix (NFLX) daily chart indicates that the price is moving within an ascending channel (shown in blue), and the sharp rise from the August 5 low has pushed the RSI indicator from the oversold zone to the brink of the overbought zone. However, resistance levels have come into focus:
→ The median of the ascending channel;
→ The peak around $697;
→ The psychological resistance around $700.
Given Friday’s weak close and the sharp rise over the past two weeks, it’s reasonable to suggest that Netflix (NFLX) shares are vulnerable to a correction.
The average price forecast for Netflix (NFLX) is $704.94 over the next 12 months (according to a survey of analysts conducted by TipRanks).
Buy and sell stocks of the world's biggest publicly-listed companies with CFDs on FXOpen’s trading platform. Open your FXOpen account now or learn more about trading share CFDs with FXOpen.
This article represents the opinion of the Companies operating under the FXOpen brand only. It is not to be construed as an offer, solicitation, or recommendation with respect to products and services provided by the Companies operating under the FXOpen brand, nor is it to be considered financial advice.
Stay ahead of the market!
Subscribe now to our mailing list and receive the latest market news and insights delivered directly to your inbox.


Latest articles

Market Analysis: GBP/USD Dips Further As EUR/GBP Regains Traction
GBP/USD failed to climb above 1.3500 and corrected some gains. EUR/GBP started a decent increase and might aim for more gains above 0.8700.
Important Takeaways for GBP/USD and EUR/GBP Analysis Today
· The British Pound


Market Insights with Gary Thomson: Oil, US Retail Sales & NFP in Focus
In this video, we’ll explore the key economic events and market trends, shaping the financial landscape. Get ready for insights into financial markets to help you navigate the week ahead. Let’s dive in!
In this episode of Market