


Nikkei 225 Index Surges Above 41,000 Points
FXOpen

As the chart indicates, the value of the Nikkei 225 stock index (Japan 225 on FXOpen) has risen above the 41,000-point level — its highest mark since July 2024.
The primary bullish driver is the conclusion of a trade agreement between the United States and Japan. According to media reports, the deal will involve Japan paying a 15% duty on exports to the US, down from the previous 25% tariff. Shares of automotive companies are among the top gainers on the Japanese stock market.
European stock indices have also risen, as EU officials are scheduled to visit Washington on Wednesday, raising hopes for a potential US-EU trade agreement.
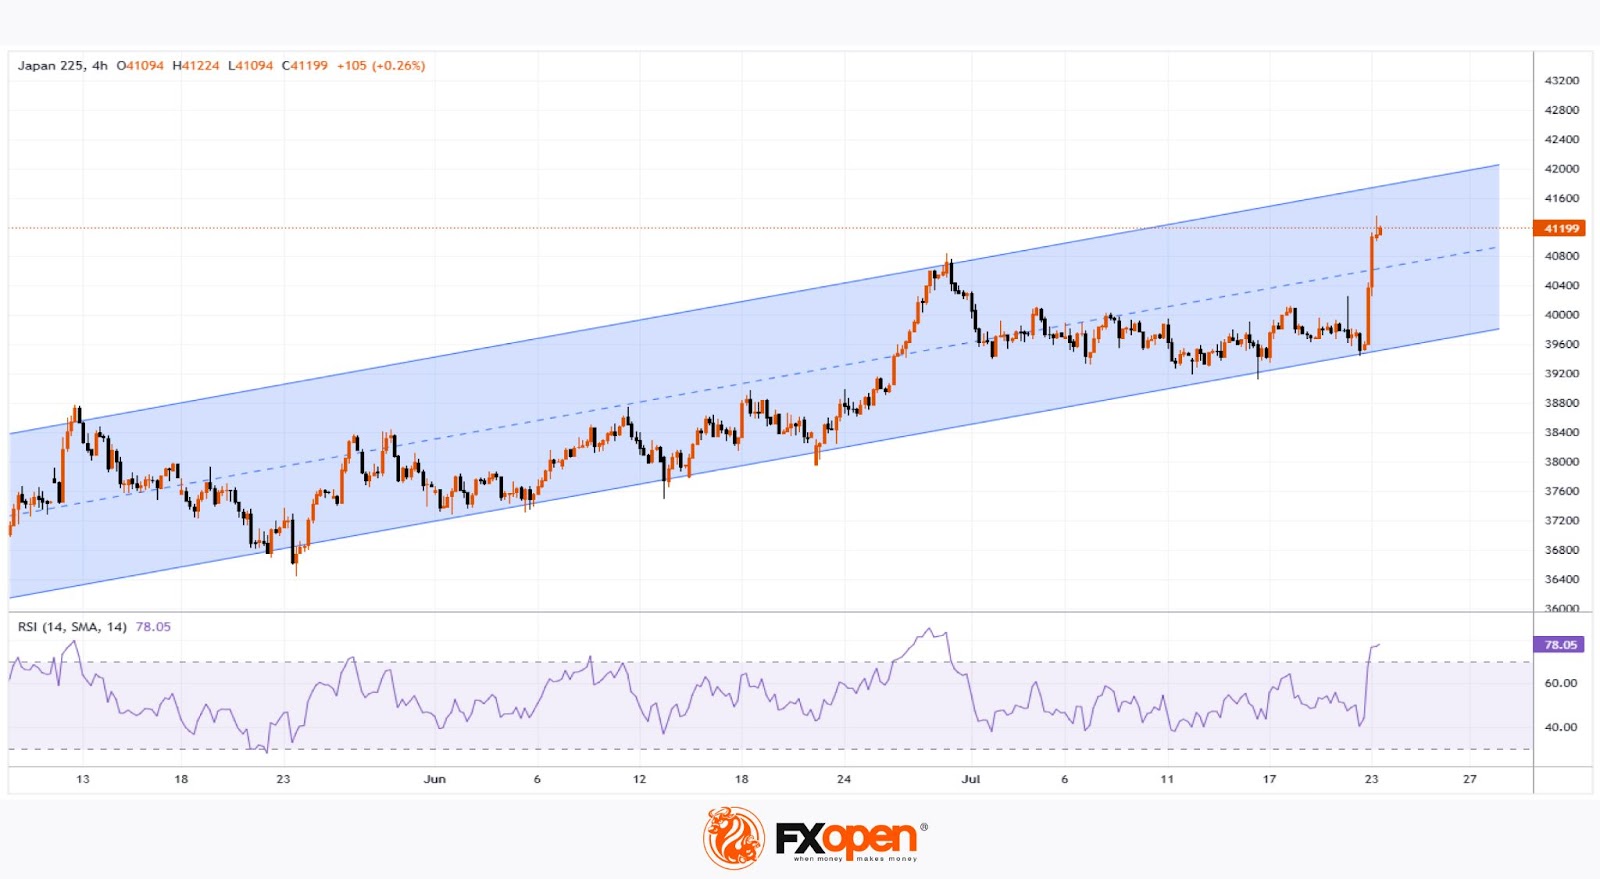
Technical Analysis of the Nikkei 225 Chart
Approximately a month ago, we outlined an ascending channel based on the price fluctuations observed in 2025. This formation remains relevant, and:
→ The price has moved into the upper half of the channel, suggesting that the median line may act as a support level going forward.
→ The nature of the latest price action is worth noting: as an immediate reaction to the news of the deal, two long bullish candles formed on the chart. However, once the price reached its 2025 high, upward momentum slowed sharply.
→ The RSI indicator signals overbought conditions.
Thus, it is reasonable to assume that, following an approximate 3.6% surge over an eight-hour period, the bullish momentum may have largely been exhausted. Nikkei 225 (Japan 225 on FXOpen) could now be vulnerable to a pullback, potentially towards the median line. Nonetheless, the ultimate direction will be shaped primarily by fundamental news.
Trade global index CFDs with zero commission and tight spreads (additional fees may apply). Open your FXOpen account now or learn more about trading index CFDs with FXOpen.
This article represents the opinion of the Companies operating under the FXOpen brand only. It is not to be construed as an offer, solicitation, or recommendation with respect to products and services provided by the Companies operating under the FXOpen brand, nor is it to be considered financial advice.
Stay ahead of the market!
Subscribe now to our mailing list and receive the latest market news and insights delivered directly to your inbox.


Latest articles

Meta Platforms: Strong Earnings Fail to Support the Share Price
Meta's revenue rose by 33% year-on-year in the first quarter of 2026, reaching $56.3 billion. Adjusted earnings per share came in at $7.31, comfortably ahead of the consensus forecast of $6.67. However, the positive earnings results were

Euro Stabilises After Sell-Off as Markets Await US CPI and Bank of Canada Meeting
The euro is showing signs of a modest recovery following a sharp decline triggered by a strong US employment report and increased demand for safe-haven assets amid escalating geopolitical tensions in the Middle East. Robust Nonfarm Payrolls data confirmed the

NVIDIA: Record Revenue Sustains Interest, but Shares Remain Under Pressure
NVIDIA's revenue for the first quarter of fiscal year 2027 surged by 85% to $81.62 billion, marking another record quarter for the company. Adjusted earnings per share came in at $1.87, exceeding the Wall Street consensus forecast of