


FXOpen

As the chart shows, the Nikkei 225 index (Japan 225 on FXOpen) reached a historic high near 58,500 points on Monday. Bullish sentiment was driven primarily by political developments.
According to media reports, the rally followed the decisive victory of the Liberal Democratic Party (LDP) under Sanae Takaichi, who has signalled aggressive fiscal stimulus measures (a package exceeding $135 bn), food tax cuts, and the continuation of an accommodative monetary policy stance.
However, today the Nikkei 225 is showing signs of a pullback. It is possible that major market participants have begun taking profits amid the wave of optimism, as Takaichi’s victory had already been largely priced in, and official confirmation of a parliamentary supermajority may have acted as a trigger to close long positions.
From a technical perspective, a retracement also appears justified.
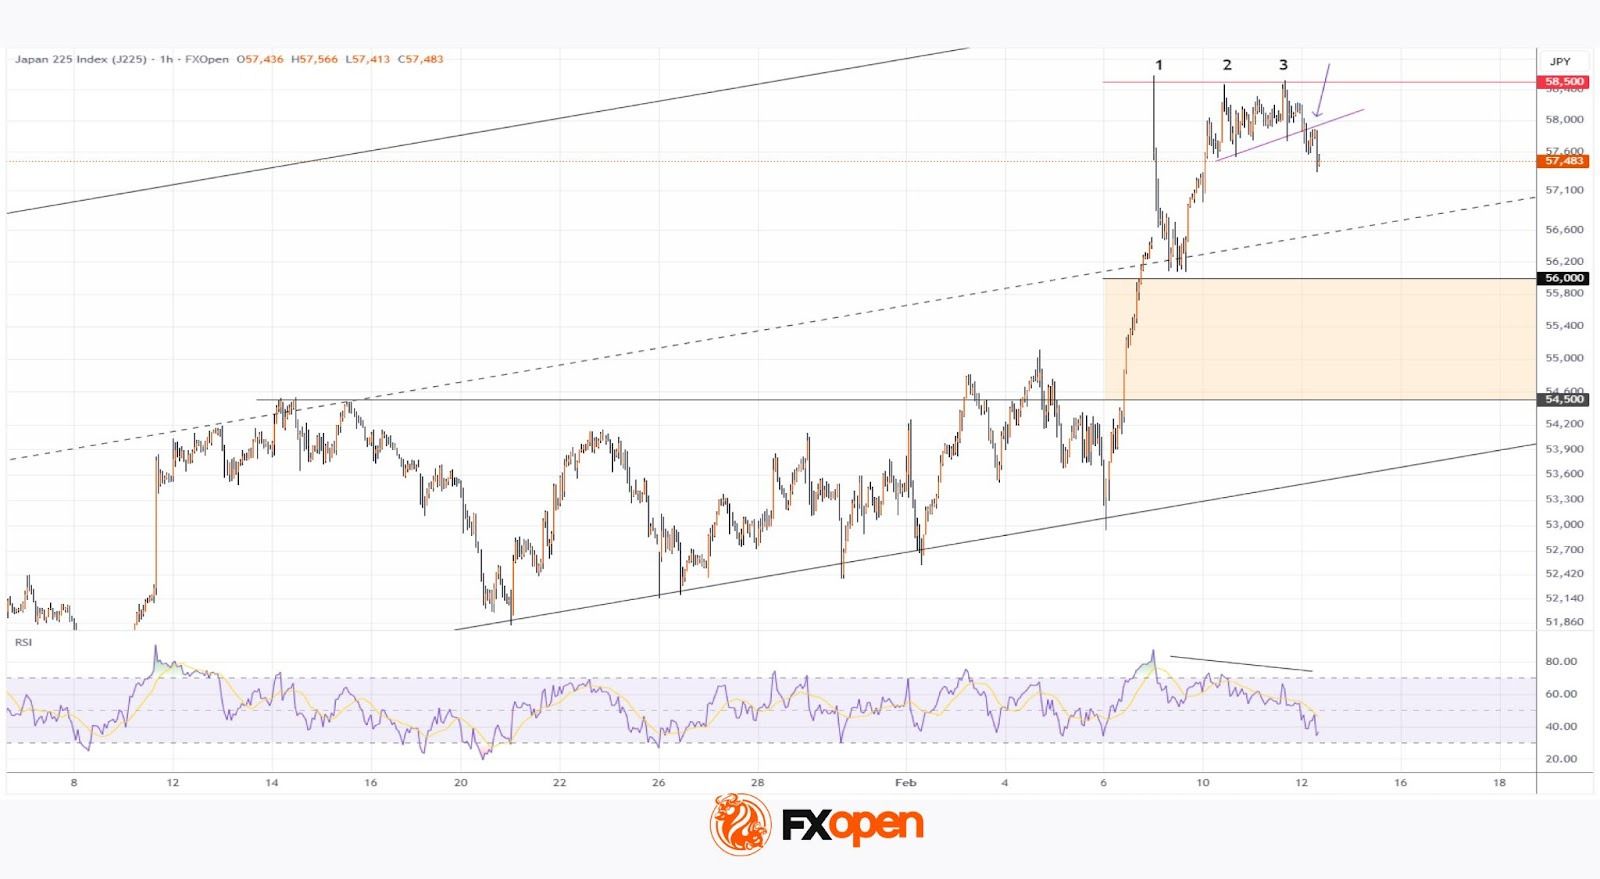
Technical Analysis of the Nikkei 225 Chart
It is worth noting that:
→ after the RSI moved into extreme overbought territory, it formed a bearish divergence with price;
→ price action itself produced a bearish triple top pattern.
As the decline unfolds, a local trendline (shown in purple) has shifted from acting as support to functioning as resistance.
In light of the above, it is reasonable to assume that an extended pullback could drive the Nikkei 225 towards the median of the long-term ascending channel.
In the event of a deeper correction, the support zone below the 56,000 level may come into play, where a previous bullish imbalance formed characteristics of a Fair Value Gap pattern.
Trade global index CFDs with zero commission and tight spreads (additional fees may apply). Open your FXOpen account now or learn more about trading index CFDs with FXOpen.
This article represents the opinion of the Companies operating under the FXOpen brand only. It is not to be construed as an offer, solicitation, or recommendation with respect to products and services provided by the Companies operating under the FXOpen brand, nor is it to be considered financial advice.
Stay ahead of the market!
Subscribe now to our mailing list and receive the latest market news and insights delivered directly to your inbox.


Latest articles

Weak Data Weigh on the Dollar: Market Awaits Trend Confirmation
The US dollar is retreating from recent highs, moving into a moderate correction after a prolonged period of gains. Pressure on the currency is building amid weaker-than-expected macroeconomic data, while market participants adopt a wait-and-see approach ahead of key labour

Market Analysis: EUR/USD Aims Recovery While USD/JPY Gives Back Recent Gains
EUR/USD is recovering losses from 1.1450. USD/JPY is correcting gains from 160.50 and might decline further below 158.00.
Important Takeaways for EUR/USD and USD/JPY Analysis Today
· The Euro struggled to stay in a

European Currencies Decline: Pound Hits New Lows, Euro Under Pressure
European currencies continue to weaken against the US dollar amid rising geopolitical tensions and increased demand for safe-haven and liquid assets. Market participants are reducing exposure to riskier instruments, putting pressure on both the euro and the pound. Additional support