


FXOpen

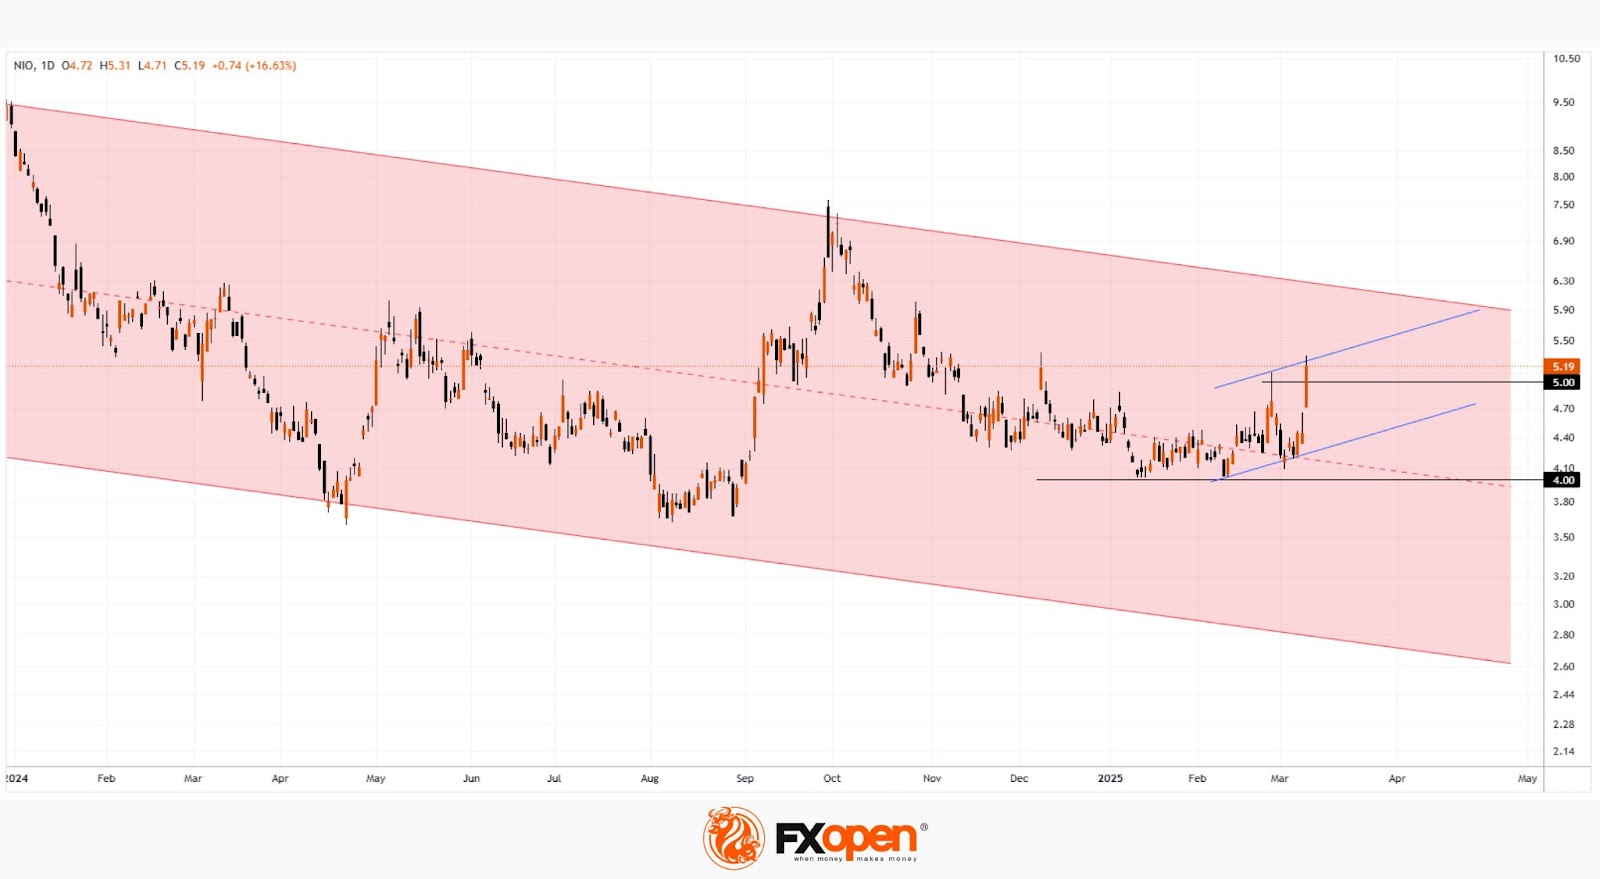
The stock chart of Chinese electric vehicle manufacturer NIO shows that its price has reached a new high for 2025, following a 10% surge yesterday.
In the process, the stock formed a wide bullish gap and successfully broke through the psychological $5 per share level.
Why Has NIO’s Share Price Risen?
The bullish sentiment is largely driven by anticipation of the company's upcoming earnings report. Last year, NIO achieved record-breaking monthly EV deliveries, reaching 31,000 units in December.
Investors are now eagerly awaiting further details about NIO’s two new mass-market brands, Onvo and Firefly. Onvo has already launched, while pre-orders for Firefly—a compact and intelligent EV priced at around $20,500—have begun.
Additionally, some investors may be shifting capital from TSLA shares (which have been experiencing a bearish trend, as reported yesterday) into NIO stock.
Technical Analysis of NIO’s Stock Chart
Looking at the bigger picture, NIO’s share price remains within a long-term downward trend (marked by the red descending channel). Since the start of 2025, the stock has fluctuated around the median line without dropping below $4 per share, a level where supply and demand have historically balanced out.
However, yesterday’s strong upward momentum suggests that the balance may have shifted in favour of the bulls. Given the positive fundamental outlook, buyers could maintain the recent gains, potentially pushing the share price towards the upper boundary of the red channel—following the trajectory outlined by the blue lines on the chart.
Buy and sell stocks of the world's biggest publicly-listed companies with CFDs on FXOpen’s trading platform. Open your FXOpen account now or learn more about trading share CFDs with FXOpen.
This article represents the opinion of the Companies operating under the FXOpen brand only. It is not to be construed as an offer, solicitation, or recommendation with respect to products and services provided by the Companies operating under the FXOpen brand, nor is it to be considered financial advice.
Stay ahead of the market!
Subscribe now to our mailing list and receive the latest market news and insights delivered directly to your inbox.


Latest articles

Market Insights with Gary Thomson: UK Jobs, US NFP & CPI, and BoJ Rate Call You Can’t Ignore
In this video, we’ll explore the key economic events and market trends, shaping the financial landscape. Get ready for insights into financial markets to help you navigate the week ahead. Let’s dive in!
In this episode of Market

S&P 500 Index: Chart Analysis After Friday’s Sell-Off
Trading on 12 December was overshadowed by a sharp decline in the S&P 500 (US SPX 500 mini on FXOpen), with the session low approaching December’s previous trough.
Among the key fundamental drivers behind Friday’s drop

10 Weakest European Currencies
While the euro may have been adopted by many European nations, plenty still use their own currencies. Some are strong, such as the British pound and Swiss franc, while others