


FXOpen

On July 31, US labour market data was released, which proved disappointing and contributed to a decline in the Nasdaq 100 index (US Tech 100 mini on FXOpen) by over 10% between August 1 and 5.
This heightens the importance of the upcoming labour market data release, scheduled for tomorrow (15:15-15:30 GMT+3). It seems that concerns are growing among market participants that the news could reveal further negative trends.
This could explain the sell-off that gripped the US stock market yesterday. The Nasdaq 100 index (US Tech 100 mini on FXOpen) dropped by more than 3%, with Nvidia (NVDA) shares losing over 9% of their value.
In the first half of 2024, NVDA was a growth leader, but now it is among the biggest decliners—a bearish signal that suggests the price decline could continue. If so, how significant could it be?
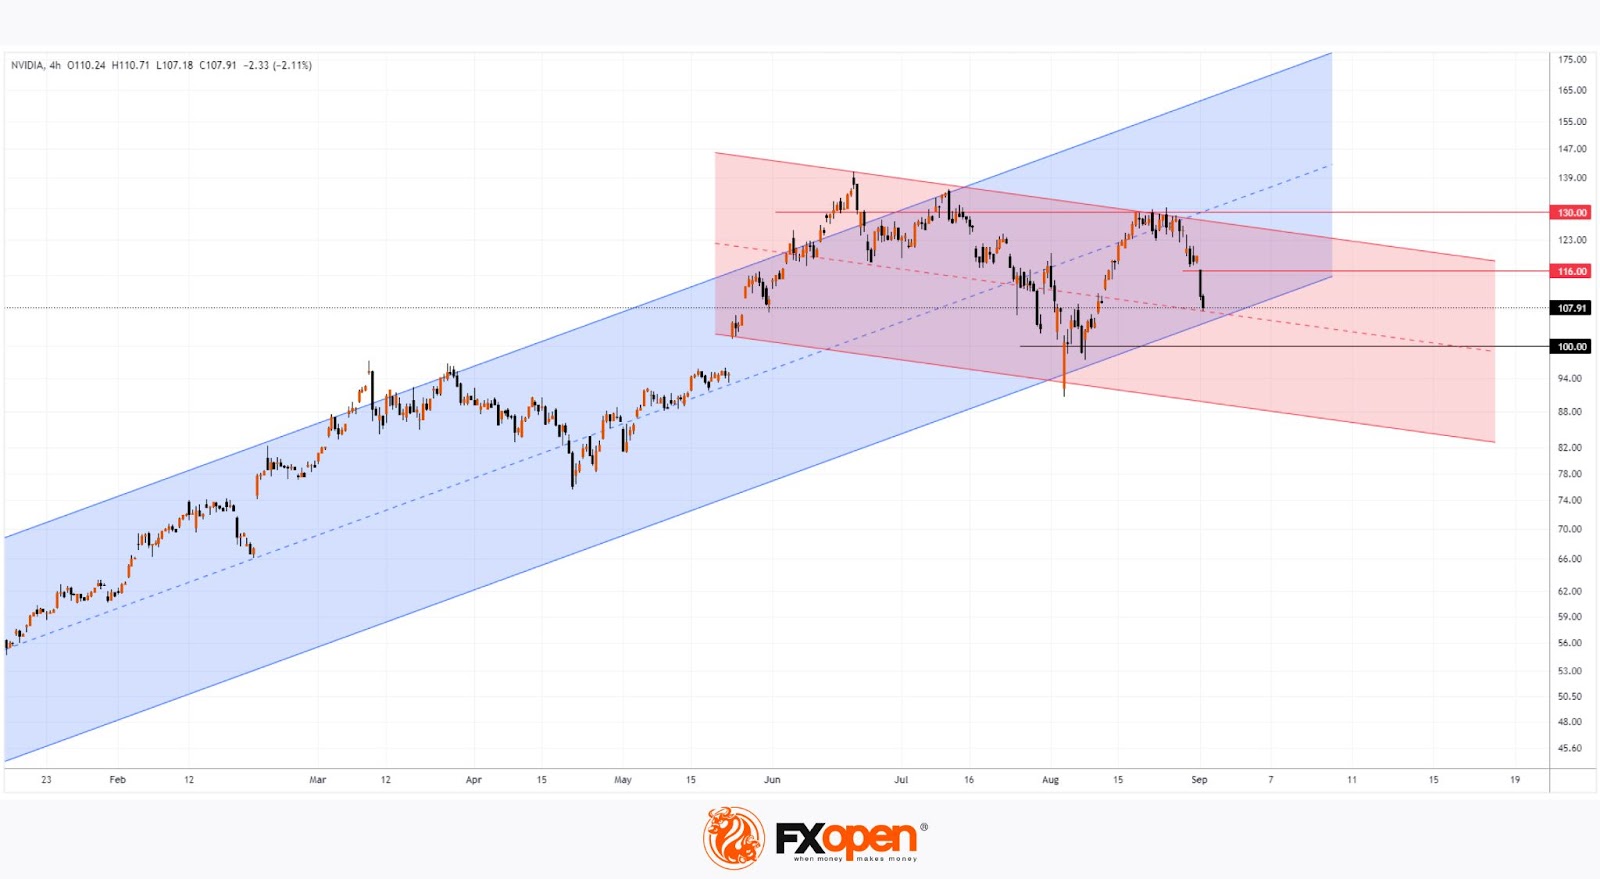
Technical analysis of Nvidia (NVDA) chart shows:
→ The price is forming an ascending channel (shown in blue) but has dropped to its lower boundary after the median line showed signs of resistance.
→ The bearish gap area around the $116 level could act as a resistance zone after the bears confirmed their control over the psychological $100 mark.
→ Alternatively, the outlines of a possible descending channel are shown in red. Today, NVDA's price is near its median line.
This suggests that the price might consolidate around the intersection of the blue channel's lower boundary and the red channel's median line.
Following this, it’s important to consider the least favorable scenario, where the descending channel takes precedence, implying a potential decline in NVDA's price below the psychological $100 level towards the lower boundary of the red channel.
Despite this, forecasts remain positive. Based on a Tipranks survey of 43 analysts, 39 recommend buying NVDA stock. Although the average price target for NVDA is $151.79 over the next 12 months, it's possible that these estimates may be revised down if the stock continues to underperform the market.
Read analytical NVDA price forecasts for 2024 and beyond.
Buy and sell stocks of the world's biggest publicly-listed companies with CFDs on FXOpen’s trading platform. Open your FXOpen account now or learn more about trading share CFDs with FXOpen.
This article represents the opinion of the Companies operating under the FXOpen brand only. It is not to be construed as an offer, solicitation, or recommendation with respect to products and services provided by the Companies operating under the FXOpen brand, nor is it to be considered financial advice.
Stay ahead of the market!
Subscribe now to our mailing list and receive the latest market news and insights delivered directly to your inbox.


Latest articles

European Currencies Decline: Pound Hits New Lows, Euro Under Pressure
European currencies continue to weaken against the US dollar amid rising geopolitical tensions and increased demand for safe-haven and liquid assets. Market participants are reducing exposure to riskier instruments, putting pressure on both the euro and the pound. Additional support

Market Analysis: GBP/USD Dips Further As EUR/GBP Regains Traction
GBP/USD failed to climb above 1.3500 and corrected some gains. EUR/GBP started a decent increase and might aim for more gains above 0.8700.
Important Takeaways for GBP/USD and EUR/GBP Analysis Today
· The British Pound
