


FXOpen

On 12 September, when analysing Nvidia’s (NVDA) stock chart, we drew an upward channel (shown in blue) and noted several resistance levels, including:
→ a downward trendline (shown in red);
→ a psychological level at $130.
As Nvidia’s (NVDA) stock chart shows, the bulls managed to overcome this resistance zone with a strong candle on 7 October (marked with an arrow).
Afterwards, Nvidia’s (NVDA) stock price reached the median line of the blue channel, but sharply reversed downwards yesterday. The bearish sentiment was driven by:
→ a broader decline in the US stock market, potentially due to investors reassessing risks following the initial corporate earnings results as the reporting season gains momentum;
→ rumours that the US government is preparing restrictive measures (which may affect Nvidia) to prevent the export of high-tech chip manufacturing technology abroad.
As a result, Nvidia’s (NVDA) stock price dropped by approximately 4% yesterday, just shy of the record set on 20 June.
What’s next?
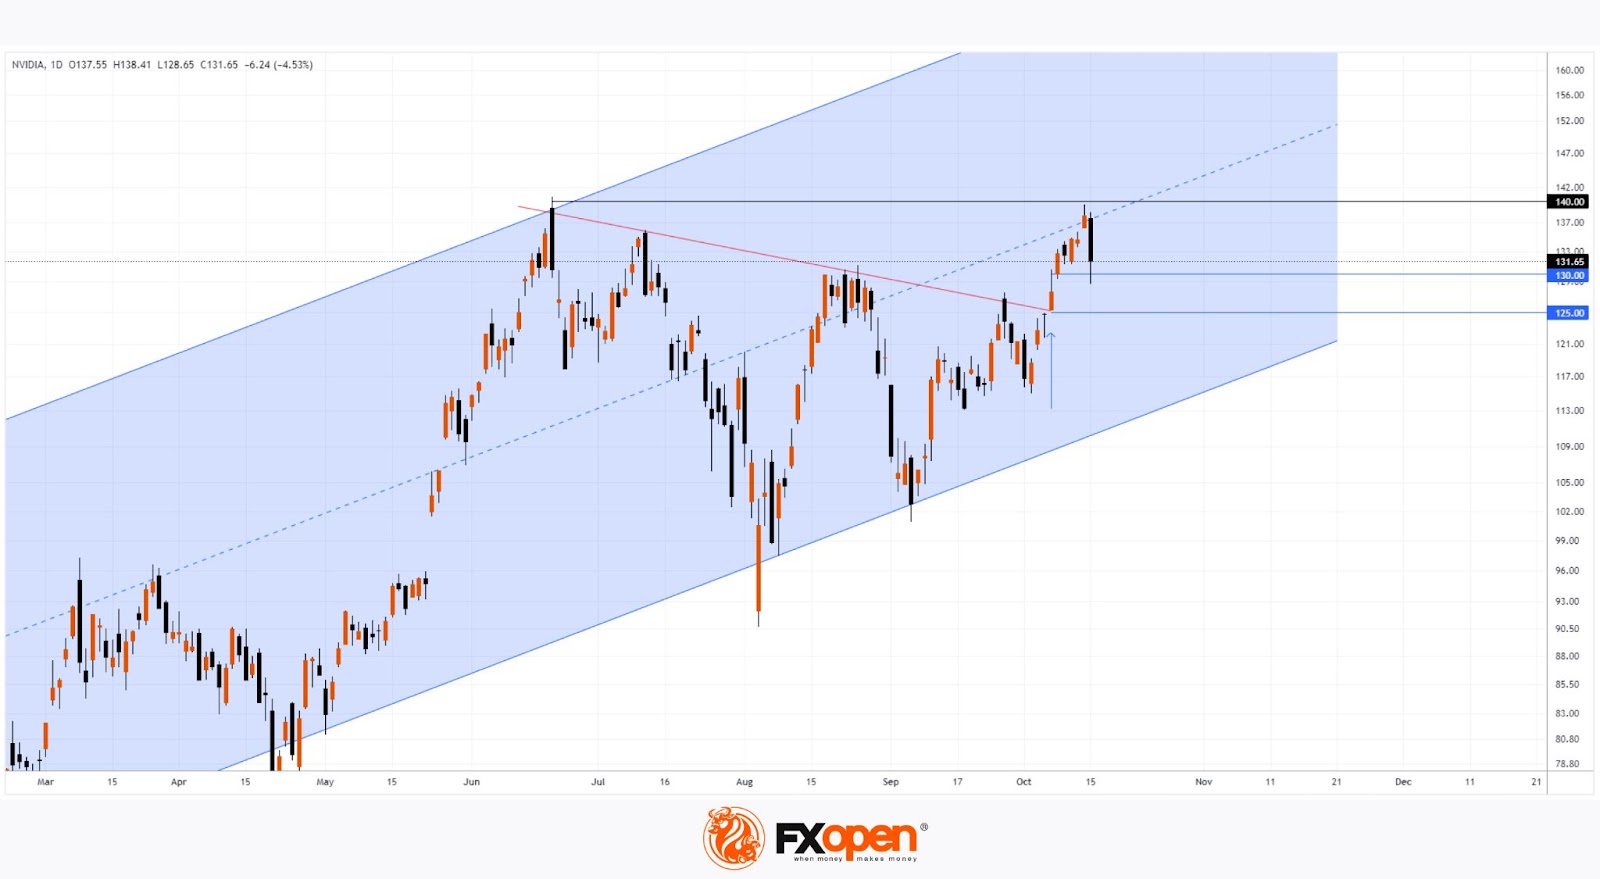
A technical analysis of Nvidia’s (NVDA) stock chart suggests that support could come from the zone formed by the strong bullish candle on 7 October:
→ this area includes a combination of psychological levels at $130 and $125;
→ here, demand forces proved their strength, overcoming the red resistance line that had been in play for nearly four months (this line could now act as support);
→ a bullish Fair Value Gap can be found on the daily chart in this area.
These bullish factors suggest that the price could make another attempt to set a new record by rebounding from the $125-130 support zone.
On the other hand, the bears are showing signs of control around the psychological level of $140, near the record high and the median line of the blue channel.
Meanwhile, forecasts remain positive. According to a Tipranks survey of 42 analysts, 39 recommend buying NVDA shares, with the average price target for NVDA standing at $152.86 in 12 months.
Buy and sell stocks of the world's biggest publicly-listed companies with CFDs on FXOpen’s trading platform. Open your FXOpen account now or learn more about trading share CFDs with FXOpen.
This article represents the opinion of the Companies operating under the FXOpen brand only. It is not to be construed as an offer, solicitation, or recommendation with respect to products and services provided by the Companies operating under the FXOpen brand, nor is it to be considered financial advice.
Stay ahead of the market!
Subscribe now to our mailing list and receive the latest market news and insights delivered directly to your inbox.


Latest articles

Market Analysis: GBP/USD Dips Further As EUR/GBP Regains Traction
GBP/USD failed to climb above 1.3500 and corrected some gains. EUR/GBP started a decent increase and might aim for more gains above 0.8700.
Important Takeaways for GBP/USD and EUR/GBP Analysis Today
· The British Pound


Market Insights with Gary Thomson: Oil, US Retail Sales & NFP in Focus
In this video, we’ll explore the key economic events and market trends, shaping the financial landscape. Get ready for insights into financial markets to help you navigate the week ahead. Let’s dive in!
In this episode of Market