


FXOpen

On 21 November, our analysis of Nvidia (NVDA) stock price revealed:
→ The continuation of a long-term upward channel (illustrated in blue).
→ The significance of resistance at the psychological level of $150.
Since then, NVDA’s stock price has failed to surpass the highlighted resistance level, despite stock indices reaching record highs, indicating Nvidia's relative underperformance compared to the broader market. It seems the AI-driven rally may be losing steam.
Investor concerns were heightened yesterday by news that China has launched an antitrust investigation into Nvidia, suspecting the company of violating the country’s competition laws. In response, Nvidia stated that it complies with its obligations wherever it operates and is ready to cooperate with regulators.
Following this announcement, NVDA’s stock price experienced a modest decline, further reinforcing a bearish outlook.
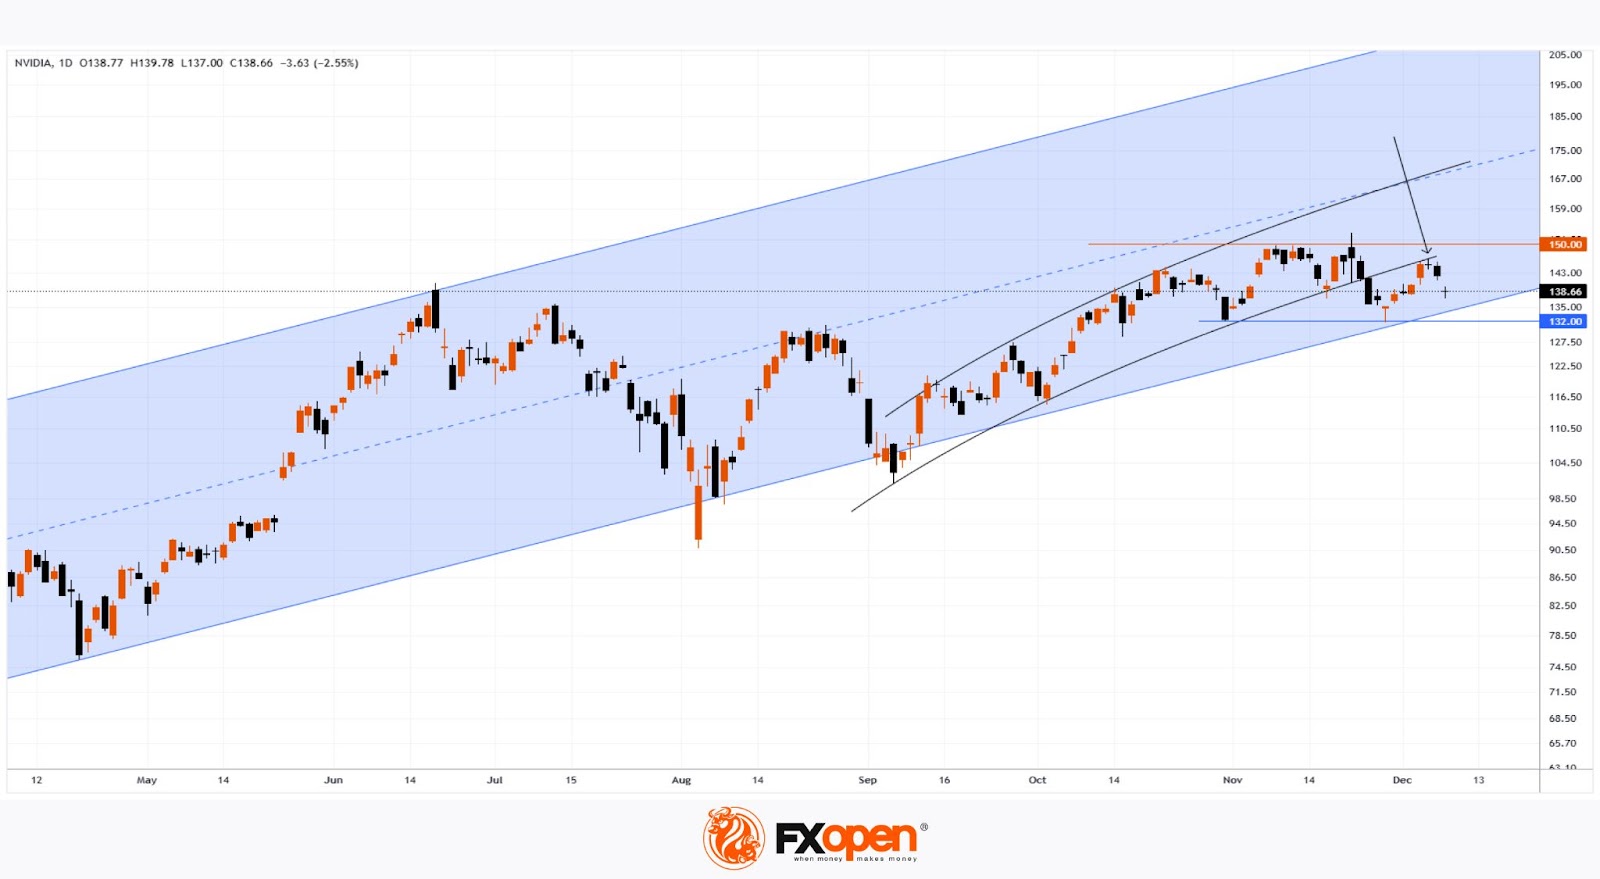
Technical analysis of Nvidia (NVDA) stock chart indicates that if the price fluctuations since September are viewed as forming a channel with curved lines (drawn in black), it becomes evident (as marked by an arrow) that the lower line has shifted its role from support to resistance — a bearish signal.
In this context, the situation appears balanced, with buyers and sellers consolidating NVDA's price within a range of $132 to $150. The eventual breakout from this range could result in a significant swing—but in which direction?
According to TipRanks, analysts remain optimistic:
→ 37 out of 40 analysts recommend buying NVDA stock.
→ The average 12-month price target for NVDA is $176.
Buy and sell stocks of the world's biggest publicly-listed companies with CFDs on FXOpen’s trading platform. Open your FXOpen account now or learn more about trading share CFDs with FXOpen.
This article represents the opinion of the Companies operating under the FXOpen brand only. It is not to be construed as an offer, solicitation, or recommendation with respect to products and services provided by the Companies operating under the FXOpen brand, nor is it to be considered financial advice.
Stay ahead of the market!
Subscribe now to our mailing list and receive the latest market news and insights delivered directly to your inbox.


Latest articles

Market Analysis: GBP/USD Dips Further As EUR/GBP Regains Traction
GBP/USD failed to climb above 1.3500 and corrected some gains. EUR/GBP started a decent increase and might aim for more gains above 0.8700.
Important Takeaways for GBP/USD and EUR/GBP Analysis Today
· The British Pound


Market Insights with Gary Thomson: Oil, US Retail Sales & NFP in Focus
In this video, we’ll explore the key economic events and market trends, shaping the financial landscape. Get ready for insights into financial markets to help you navigate the week ahead. Let’s dive in!
In this episode of Market