FXOpen

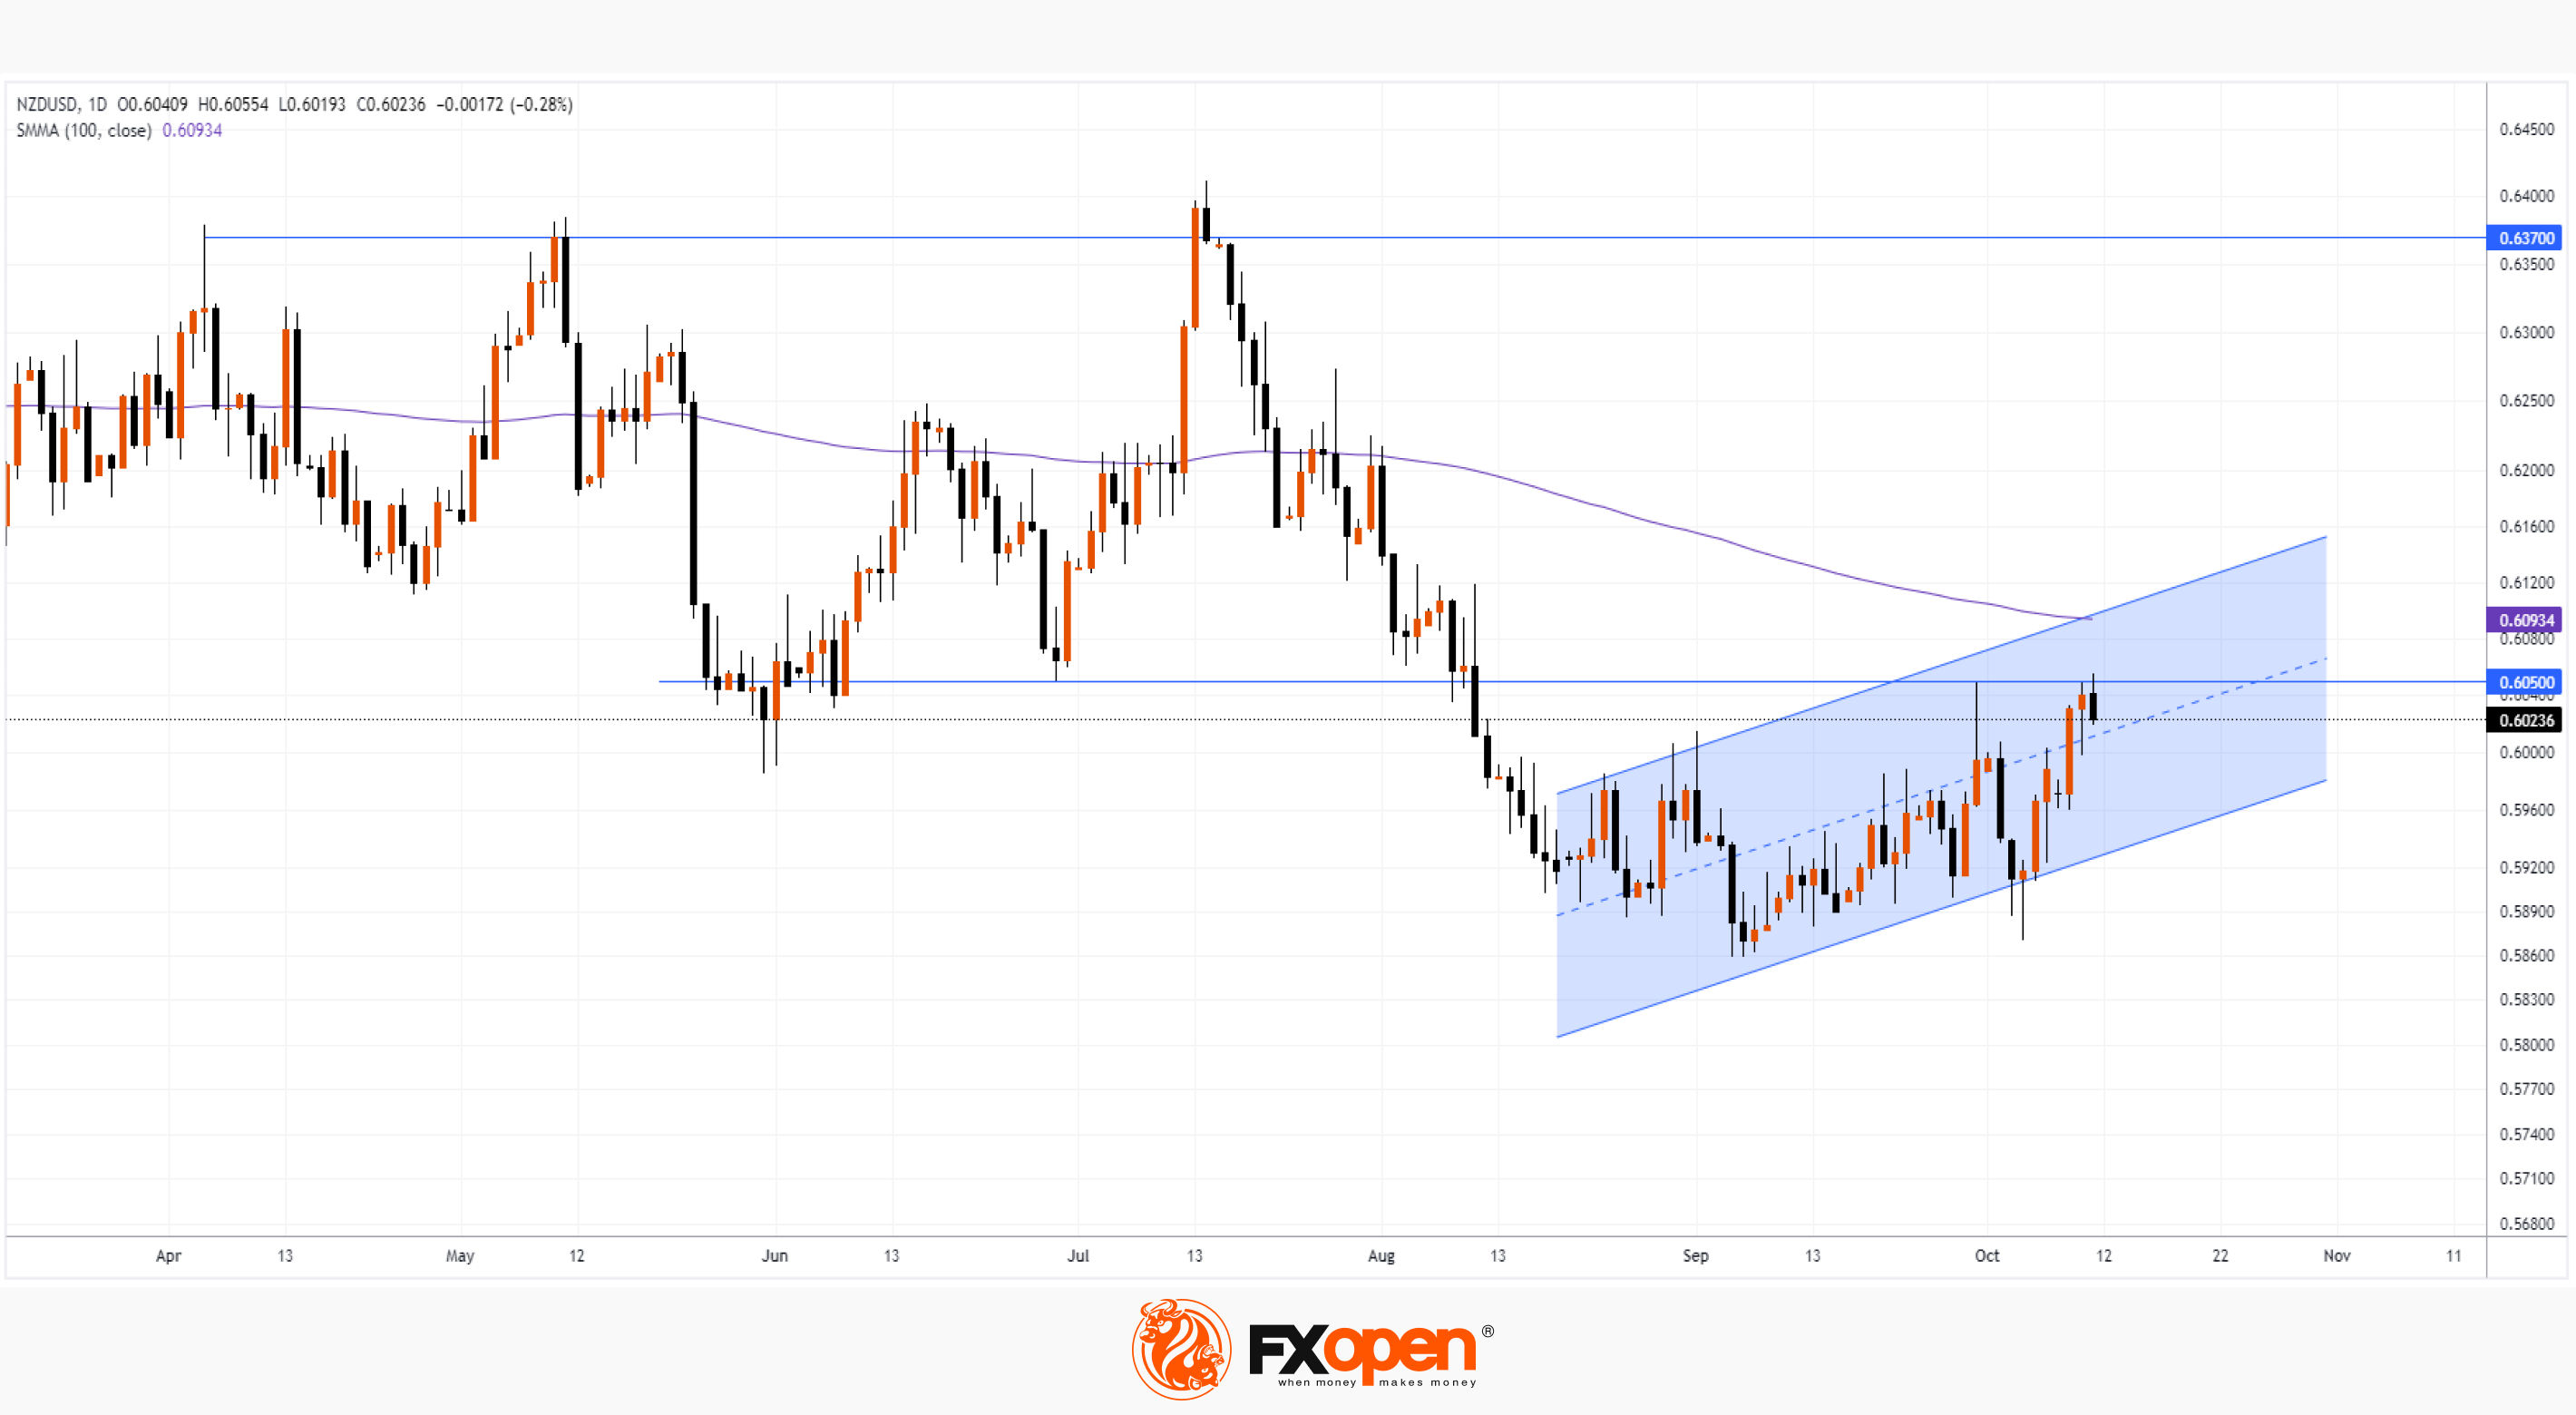
This morning, as the NZD/USD chart shows, one USD was worth 0.605 New Zealand dollar, for the first time since August 10.
The strengthening of NZD was facilitated by:
→ rumours that China is planning a major stimulus package to boost the economy amid the real estate crisis. And the Australian and New Zealand dollars, as one can see, are showing growth against the backdrop of positive news from China;
→ the weakness of the US dollar due to the fact that Fed members make it clear in their statements that it is no longer worth raising rates further.

Will the NZD/USD pair continue its upward trend?
The chart points to important bearish arguments:
→ the level of 0.605 previously served as long-term support. This can be seen from the price action in the spring-summer of this year. After the bearish breakout in the first half of August, this level has already shown its role as resistance, as seen in the September 29th candle;
→ exceeding the 0.605 level today, as well as the high on September 29, could be a trap for the bulls. A similar phenomenon can be seen on July 13-14, when the price exceeded previous local highs for only a short time. And, note, the current excess of the 0.605 level may also be very fleeting;
→ SMA (100) slopes down, indicating that bearish sentiment prevails over the long term.
News from the United States can have an important impact on the current situation. Statements by FOMC members are scheduled for today at 21:00 GMT+3 — be careful, spikes in volatility are likely.
Trade over 50 forex markets 24 hours a day with FXOpen. Take advantage of low commissions, deep liquidity, and spreads from 0.0 pips (additional fees may apply). Open your FXOpen account now or learn more about trading forex with FXOpen.
This article represents the opinion of the Companies operating under the FXOpen brand only. It is not to be construed as an offer, solicitation, or recommendation with respect to products and services provided by the Companies operating under the FXOpen brand, nor is it to be considered financial advice.
Stay ahead of the market!
Subscribe now to our mailing list and receive the latest market news and insights delivered directly to your inbox.


