


NZD/USD Technical Analysis: Bearish Start To News-heavy Week
FXOpen

After 8 consecutive days of growth, the price of NZD/USD is forming a bearish candle this morning, thereby indicating possible concerns among market participants at the beginning of a week full of important economic news:
→ On Wednesday, at 4:00 GMT+3, the RBNZ decision on interest rates will be published. There will also be a press conference by the leadership of the Central Bank.
→ On the same day, at 16:30 GMT+3, news about US GDP is expected.
→ On Thursday, at 16:30 GMT+3, inflation data in the United States will be published, namely Core PCE Price Index GMT+3.
Note that in 2023, the NZD/USD price behaved bearishly, forming a downward channel (shown in red).
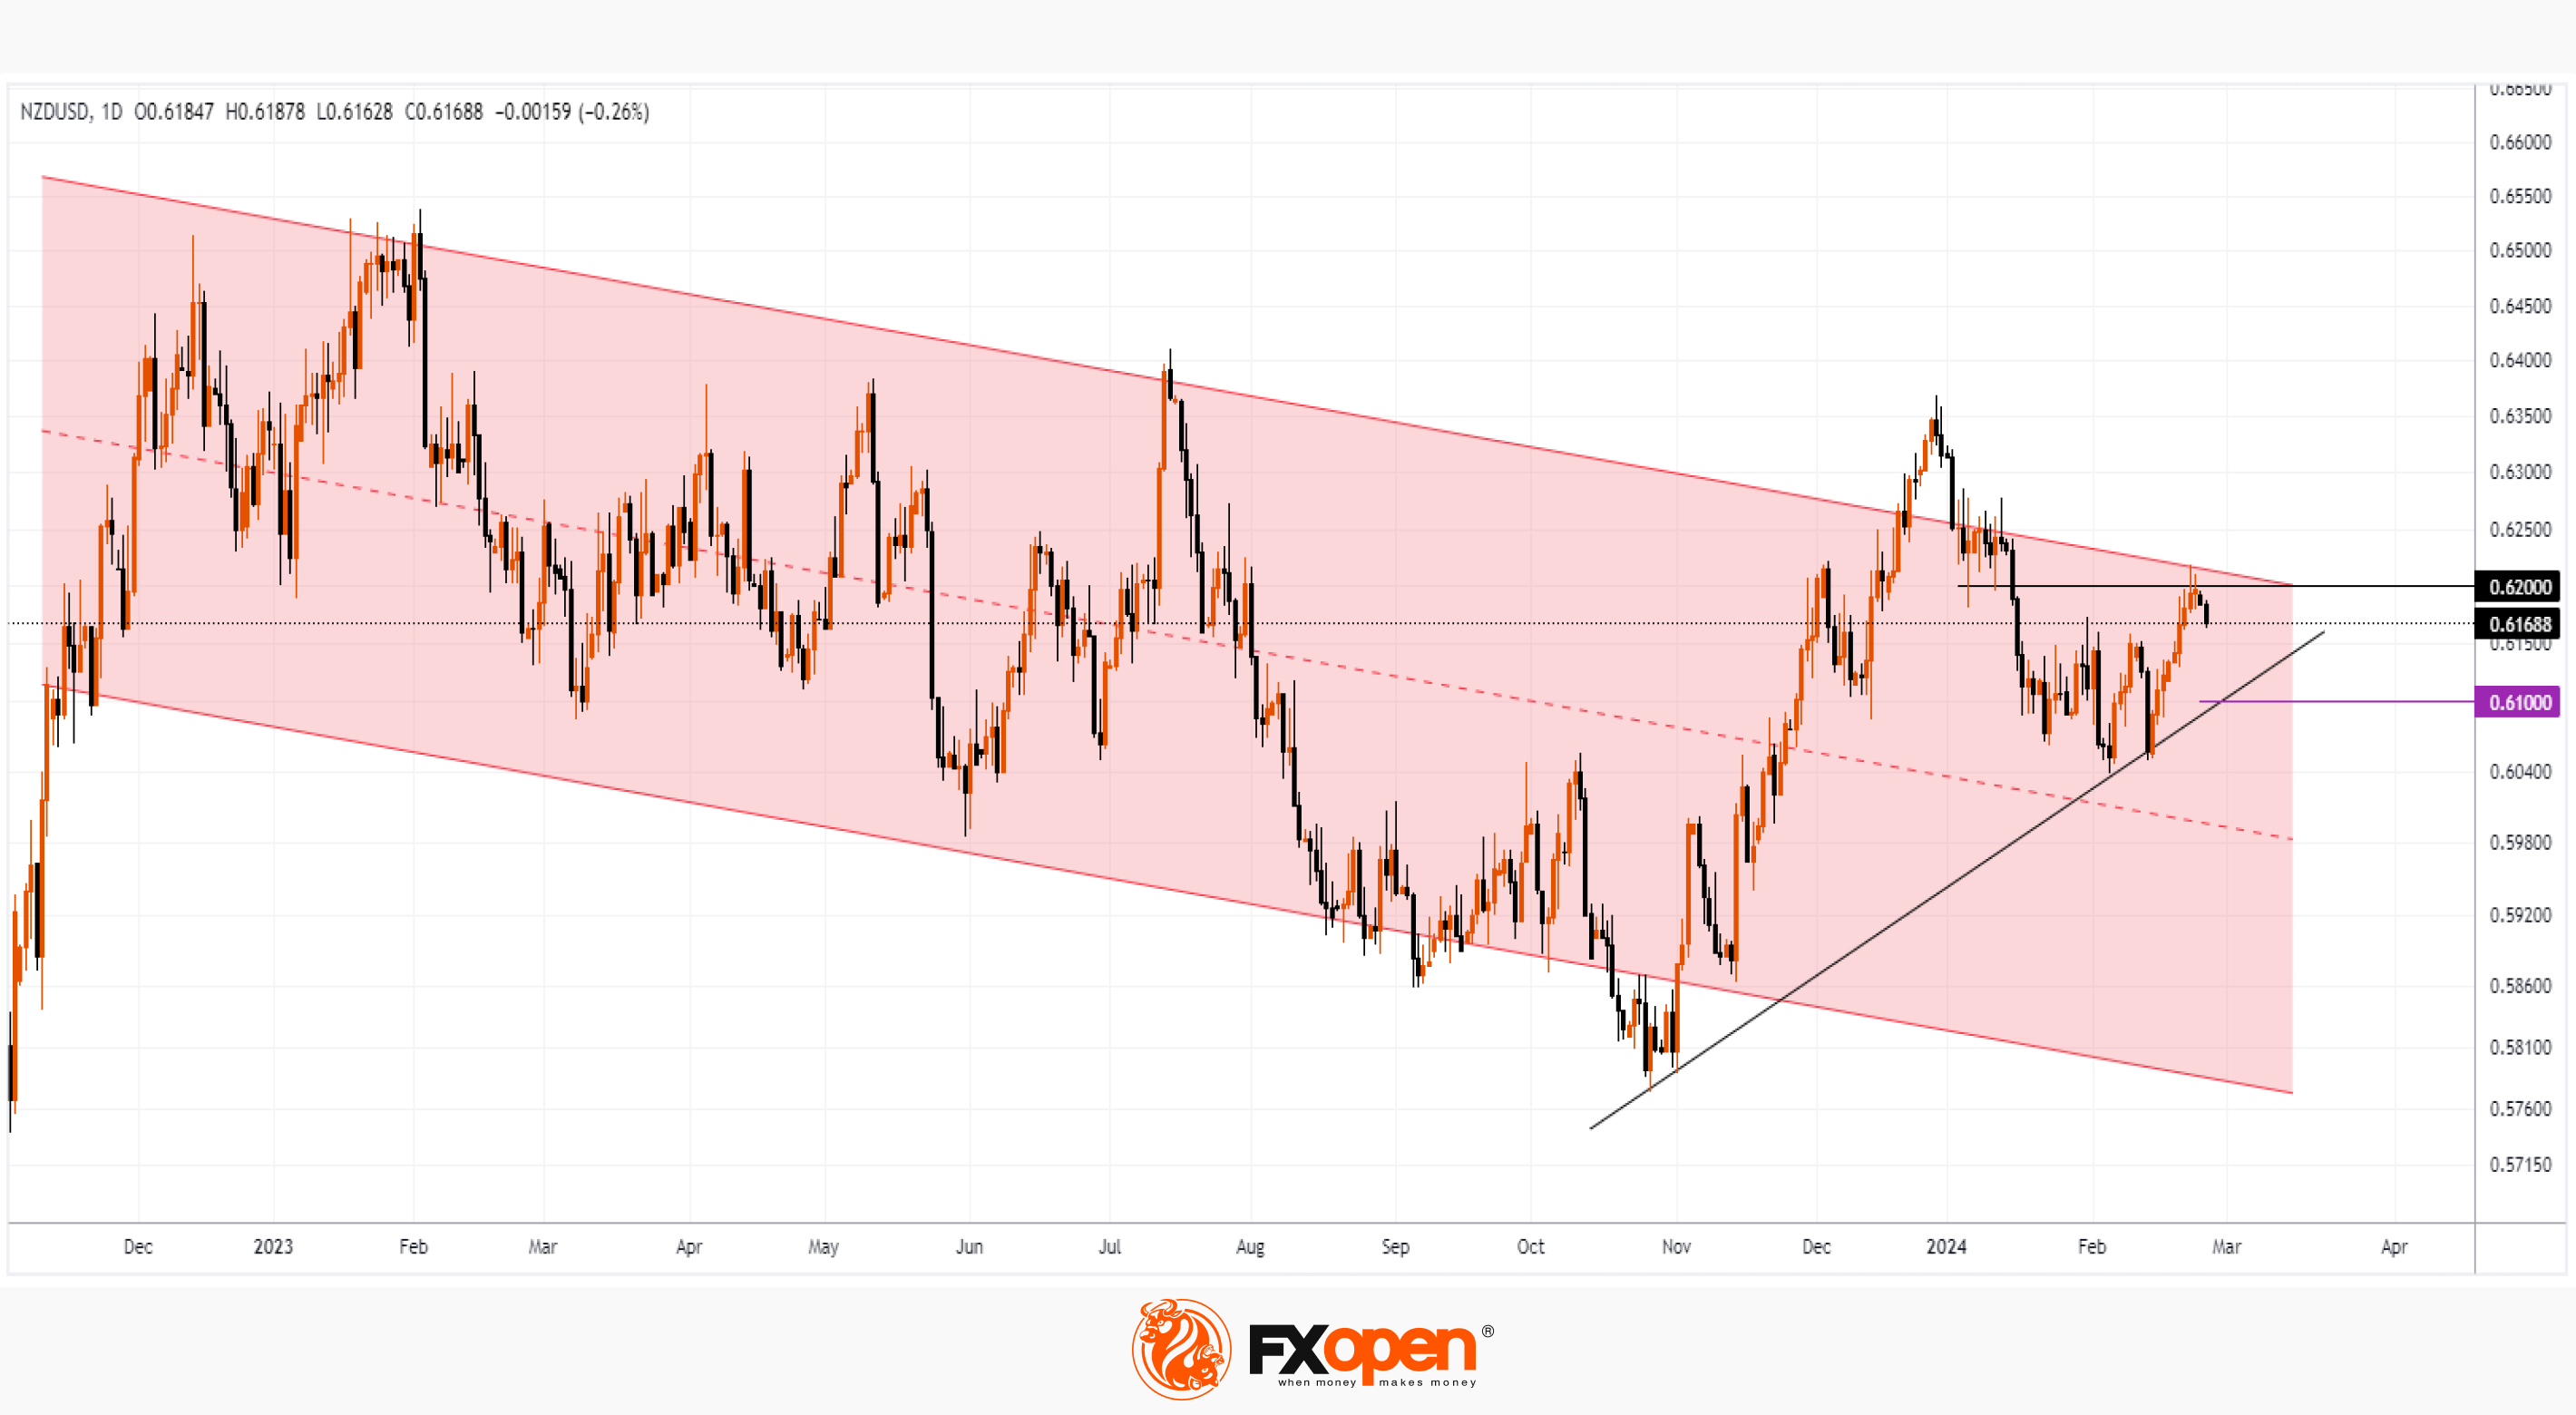
Technical analysis of the NZD/USD price chart provides confirmation of bearish sentiment in the form of a test of the 0.62 level — which showed support in early January and now appears to be resisting.
If the news acts as a driver for downward momentum:
→ the price of NZD/USD may fall towards the trend line shown in black. It is enhanced by the psychological level of 0.61.
→ This could result in a strategic reversal downwards from the area where the upper border of the red channel lies.
Be prepared for spikes in volatility throughout the week.
Trade over 50 forex markets 24 hours a day with FXOpen. Take advantage of low commissions, deep liquidity, and spreads from 0.0 pips (additional fees may apply). Open your FXOpen account now or learn more about trading forex with FXOpen.
This article represents the opinion of the Companies operating under the FXOpen brand only. It is not to be construed as an offer, solicitation, or recommendation with respect to products and services provided by the Companies operating under the FXOpen brand, nor is it to be considered financial advice.
Stay ahead of the market!
Subscribe now to our mailing list and receive the latest market news and insights delivered directly to your inbox.


Latest articles

US Dollar Index: A Defining Week for the King of the Markets
The dollar heads into a pivotal week trading near 101.80, just off a 15-month high, with the Fed's July 29 meeting standing as the clear focal point. Markets currently price roughly a 65% chance of a hold, though renewed

NZD/USD: Inflation Surge Meets Strong US Dollar Pressure
On 21 July, Stats NZ reported an acceleration in inflation: the Consumer Price Index rose 1.5% in the second quarter, while the annual inflation rate climbed to 4.1%, its highest level in more than two years and slightly

Weekly Market Insights with Gary Thomson: The Week of Central Banks and Earnings
In this video, we’ll explore the key economic events and market trends, shaping the financial landscape. Get ready for insights into financial markets to help you navigate the week ahead. Let’s dive in!
In this episode of Market