


Oil Prices Rise on Geopolitical Factors
FXOpen

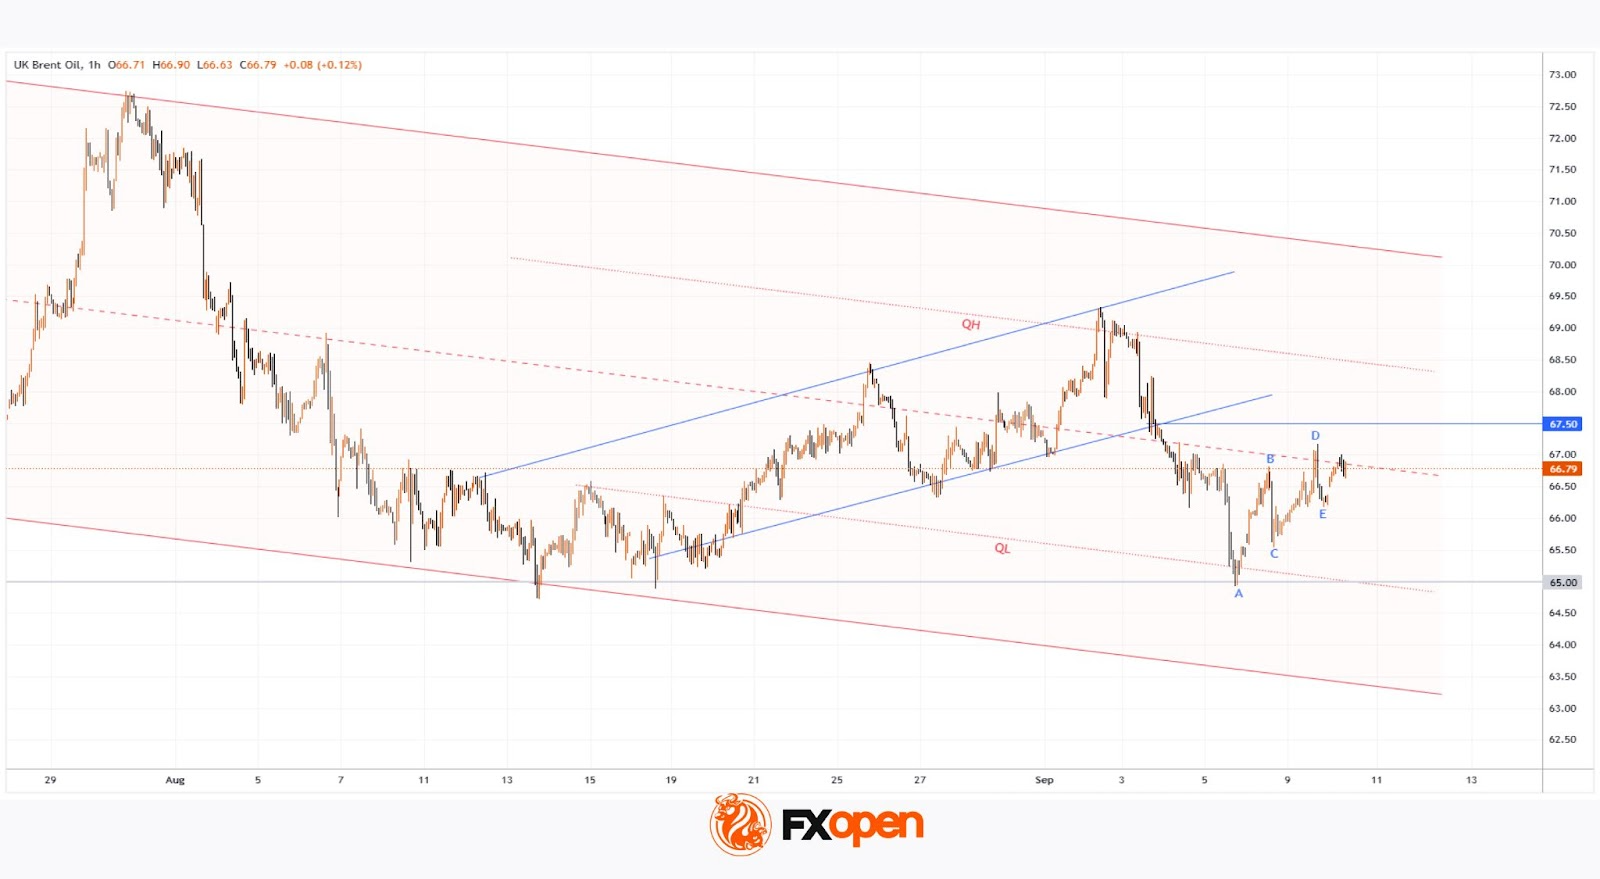
As the XBR/USD chart shows, Brent crude opened this week’s trading around $65.70, but today the price is near $66.80 (around +1.7%).
Oil is being pushed higher by geopolitical factors, including:
→ Israel’s strike on Hamas leadership in Qatar;
→ Trump’s calls for Europe to impose tariffs on buyers of Russian oil.
It is also worth noting that over the weekend an OPEC+ meeting took place. Although the decision was made to increase production, the volumes were smaller than analysts had expected.
Technical Analysis of the XBR/USD Chart
After the surge of extreme volatility at the end of July, Brent crude price fluctuations have been forming a descending channel (shown in red), with the following developments:
→ in September the price tested the lines dividing the channel into quarters (2 September – QH test, 5 September – QL test);
→ this week’s rise in oil looks like a return to the median, where supply and demand tend to balance out (in other words, where market participants more often agree on a fair price).
From a bullish perspective:
→ the $65.00 level appears to be an important support, having already proved its strength in August and September;
→ the sequence of higher highs and lows A→B→C→D→E suggests that pullbacks have been roughly half the size of bullish impulses – a sign of strong demand.
From a bearish perspective:
→ August price action suggests that a bear flag has formed as an interim correction within the prevailing downtrend;
→ the $67.50 level may act as strong resistance, as supply forces there were able to trigger a bearish breakout of the pattern.
Taking the above into account, we could assume that Brent prices may stabilise around the median in the short term, before sliding along it downwards – unless the balance of supply and demand shifts sharply (for example, under the influence of new geopolitical factors or the release of major economic indicators).
Start trading commodity CFDs with tight spreads (additional fees may apply). Open your trading account now or learn more about trading commodity CFDs with FXOpen.
This article represents the opinion of the Companies operating under the FXOpen brand only. It is not to be construed as an offer, solicitation, or recommendation with respect to products and services provided by the Companies operating under the FXOpen brand, nor is it to be considered financial advice.
Stay ahead of the market!
Subscribe now to our mailing list and receive the latest market news and insights delivered directly to your inbox.


Latest articles

CAD/JPY: The Yen's Most Historic Move in 30 Years Meets a Fragile Support
Two central banks are heading in genuinely opposite directions this week, and the tension is unmistakable. The Bank of Canada held rates steady at 2.25% on September 2, with a mildly hawkish tilt as policymakers acknowledged a broadening economic

USD/JPY and USD/CAD Await Key Fed Decision
The US dollar is consolidating against the yen and Canadian dollar ahead of the key event of the week — the Federal Reserve meeting. The Fed is widely expected to raise its policy rate by 25 basis points to a range

UnitedHealth: Fundamentals Are Healing, Now the Chart Must Agree
UnitedHealth finds itself in a genuinely split narrative right now, trading near $388, down about 15.9% from its 52-week high, even as the fundamental picture keeps improving. Q2 earnings beat expectations, with revenue of $112.03 billion, and the