


FXOpen

As the chart shows, Oracle Corp. (ORCL) closed yesterday’s trading session above $155, and during the session, the stock even climbed above $160, marking an all-time high.
The bullish sentiment is driven by a strong quarterly earnings report:
→ Earnings per share were $1.39, surpassing the $1.33 expected by FactSet analysts.
→ Revenue rose to $13.31 billion from $12.45 billion, beating the forecast of $13.23 billion.
"With cloud services becoming Oracle’s largest business, the growth in our operating profit and earnings per share has accelerated," said CEO Safra Catz in a press release.
Investors reacted positively to news of Oracle’s partnership with Amazon Web Services and projections of accelerated growth in the company’s order backlog.
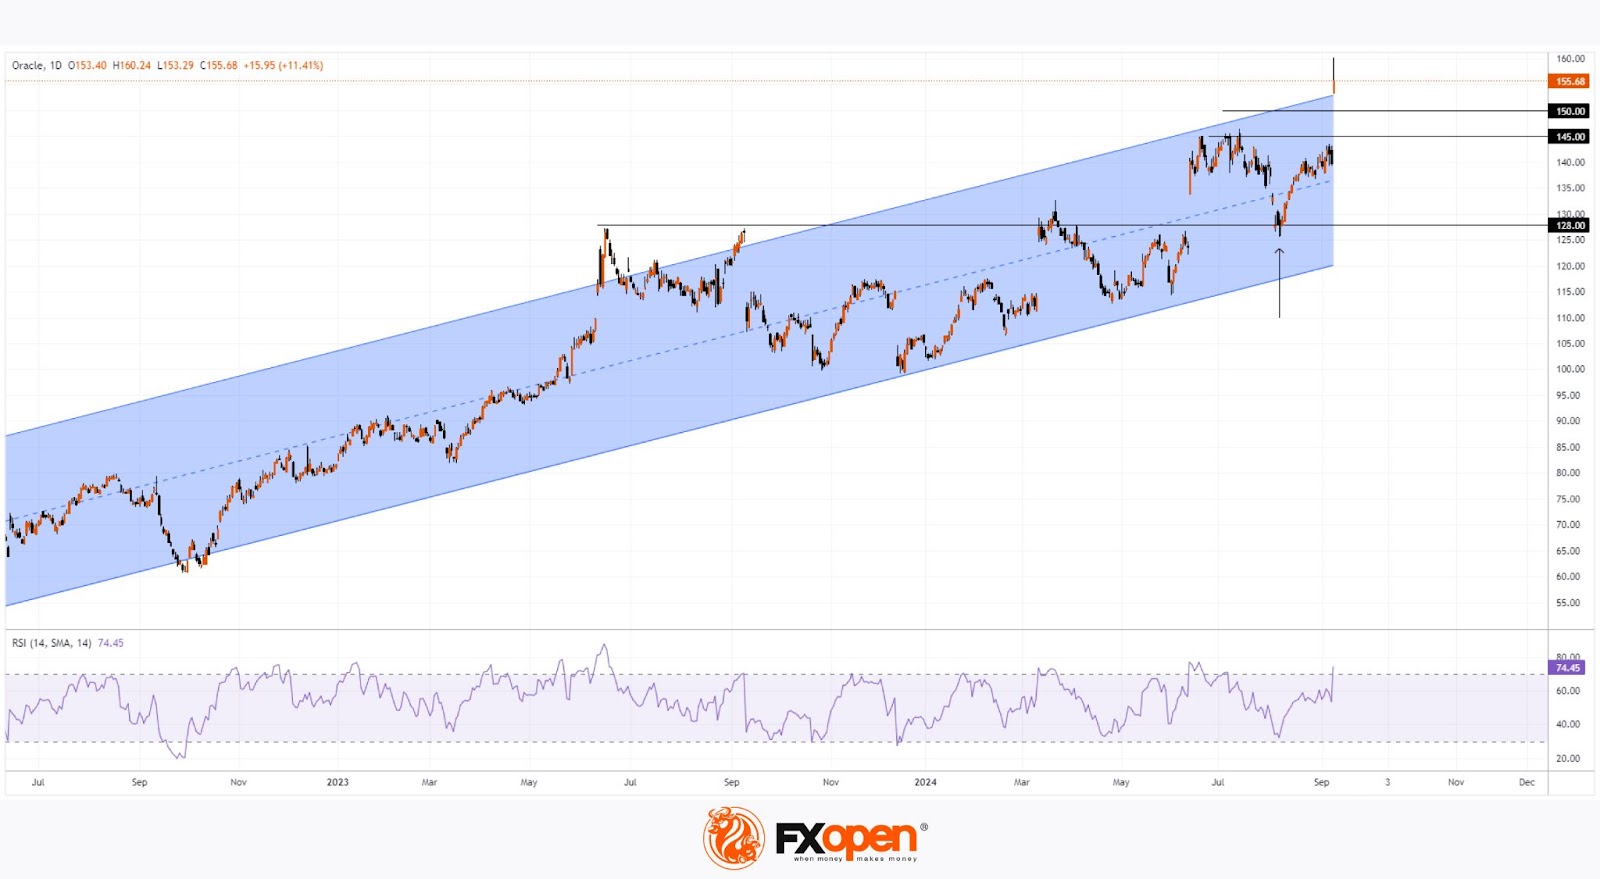
However, technical analysis of Oracle Corp. (ORCL) shares suggests the market might be “overheated.” This is indicated by:
→ The price's position relative to the linear regression channel, which started in 2022. The price is significantly above the upper boundary.
→ The RSI indicator entering the overbought zone.
This situation is reminiscent of June 2023, when the price rose above the upper boundary of the channel but failed to break $128, eventually falling back below the median.
It’s possible that the current optimism around the strong report could fade, and profit-taking might lead to a correction. In this case, Oracle Corp. (ORCL) shares could test a potential support area formed by the psychological level of $150 and the former resistance of $145, which may switch roles, as seen with the $128 level (indicated by the arrow).
Buy and sell stocks of the world's biggest publicly-listed companies with CFDs on FXOpen’s trading platform. Open your FXOpen account now or learn more about trading share CFDs with FXOpen.
This article represents the opinion of the Companies operating under the FXOpen brand only. It is not to be construed as an offer, solicitation, or recommendation with respect to products and services provided by the Companies operating under the FXOpen brand, nor is it to be considered financial advice.
Stay ahead of the market!
Subscribe now to our mailing list and receive the latest market news and insights delivered directly to your inbox.


Latest articles

European Currencies Decline: Pound Hits New Lows, Euro Under Pressure
European currencies continue to weaken against the US dollar amid rising geopolitical tensions and increased demand for safe-haven and liquid assets. Market participants are reducing exposure to riskier instruments, putting pressure on both the euro and the pound. Additional support

Market Analysis: GBP/USD Dips Further As EUR/GBP Regains Traction
GBP/USD failed to climb above 1.3500 and corrected some gains. EUR/GBP started a decent increase and might aim for more gains above 0.8700.
Important Takeaways for GBP/USD and EUR/GBP Analysis Today
· The British Pound
