


FXOpen
The PepsiCo stock chart indicates:
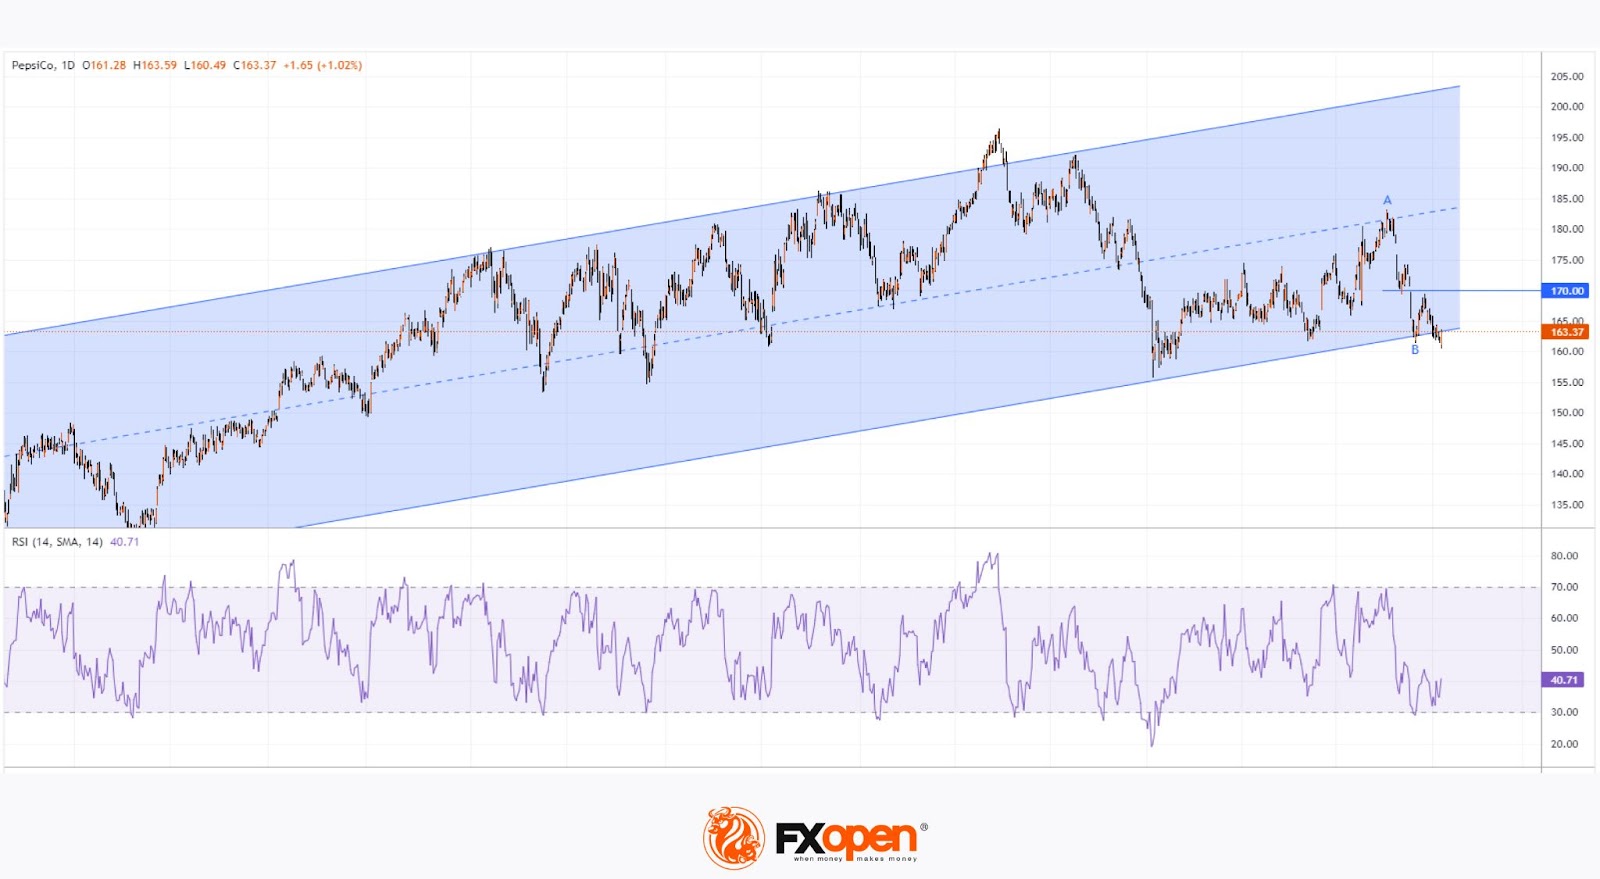
→ Yesterday, the price dropped below $161, setting a new low for 2024.
→ However, by the end of the trading day, the price rose above $163.3, closing near the day's high.
This bullish intraday behaviour might suggest positive sentiment emerging ahead of today's earnings report.
According to Dow Jones Newswires:
→ PepsiCo's management anticipates organic revenue growth of 4% and an 8% increase in earnings per share in 2024.
→ The consensus among analysts tracked by FactSet is a 3% rise in sales and a 7% increase in earnings.
PepsiCo's stock has fallen by 9% over the past two months. Investors are concerned that demand might suffer due to rising prices from inflation and the growing popularity of weight-loss drugs, which could curb people's cravings for snacks and sugary drinks.
Technical Analysis of the PEP Daily Chart Today Shows:
→ In the long term, the PEP price is in an uptrend (shown in blue).
→ The price decline from the May high (point A) has brought the price to the lower boundary of this channel, suggesting a potential buying opportunity.
→ The RSI indicator at point B (13 June) fell into the oversold zone, and yesterday's price action might be forming a bullish divergence.
Today's earnings report will provide more clarity. If investors see strong sales results, the PEP stock price might receive a bullish boost. In such a case, resistance could be encountered around the $170 level.
According to TipRanks analysts' forecast monitoring, the average target price for PEP stock is $187.40, representing a 14.55% increase from current levels in the next 12 months.
Buy and sell stocks of the world's biggest publicly-listed companies with CFDs on FXOpen’s trading platform. Open your FXOpen account now or learn more about trading share CFDs with FXOpen.
This article represents the opinion of the Companies operating under the FXOpen brand only. It is not to be construed as an offer, solicitation, or recommendation with respect to products and services provided by the Companies operating under the FXOpen brand, nor is it to be considered financial advice.
Stay ahead of the market!
Subscribe now to our mailing list and receive the latest market news and insights delivered directly to your inbox.


Latest articles

Market Analysis: GBP/USD Dips Further As EUR/GBP Regains Traction
GBP/USD failed to climb above 1.3500 and corrected some gains. EUR/GBP started a decent increase and might aim for more gains above 0.8700.
Important Takeaways for GBP/USD and EUR/GBP Analysis Today
· The British Pound


Market Insights with Gary Thomson: Oil, US Retail Sales & NFP in Focus
In this video, we’ll explore the key economic events and market trends, shaping the financial landscape. Get ready for insights into financial markets to help you navigate the week ahead. Let’s dive in!
In this episode of Market