


FXOpen
Investors in the US stock market have serious reasons to worry:
→ The likelihood of a shutdown of government agencies is becoming more and more real. It could happen as early as next week if a budget agreement is not reached (A new fiscal year begins on October 1 in the United States).
→ The prospect of a high policy rate that could last longer than expected is weighing heavily, causing the S&P 500 to decline markedly since last Wednesday's Fed meeting.
→ According to MarketWatch, the so-called “fear index” (using several input data, including the Cboe VIX volatility index) reached the “extreme fear” level for the first time since March 15, when a series of US bank failures occurred.
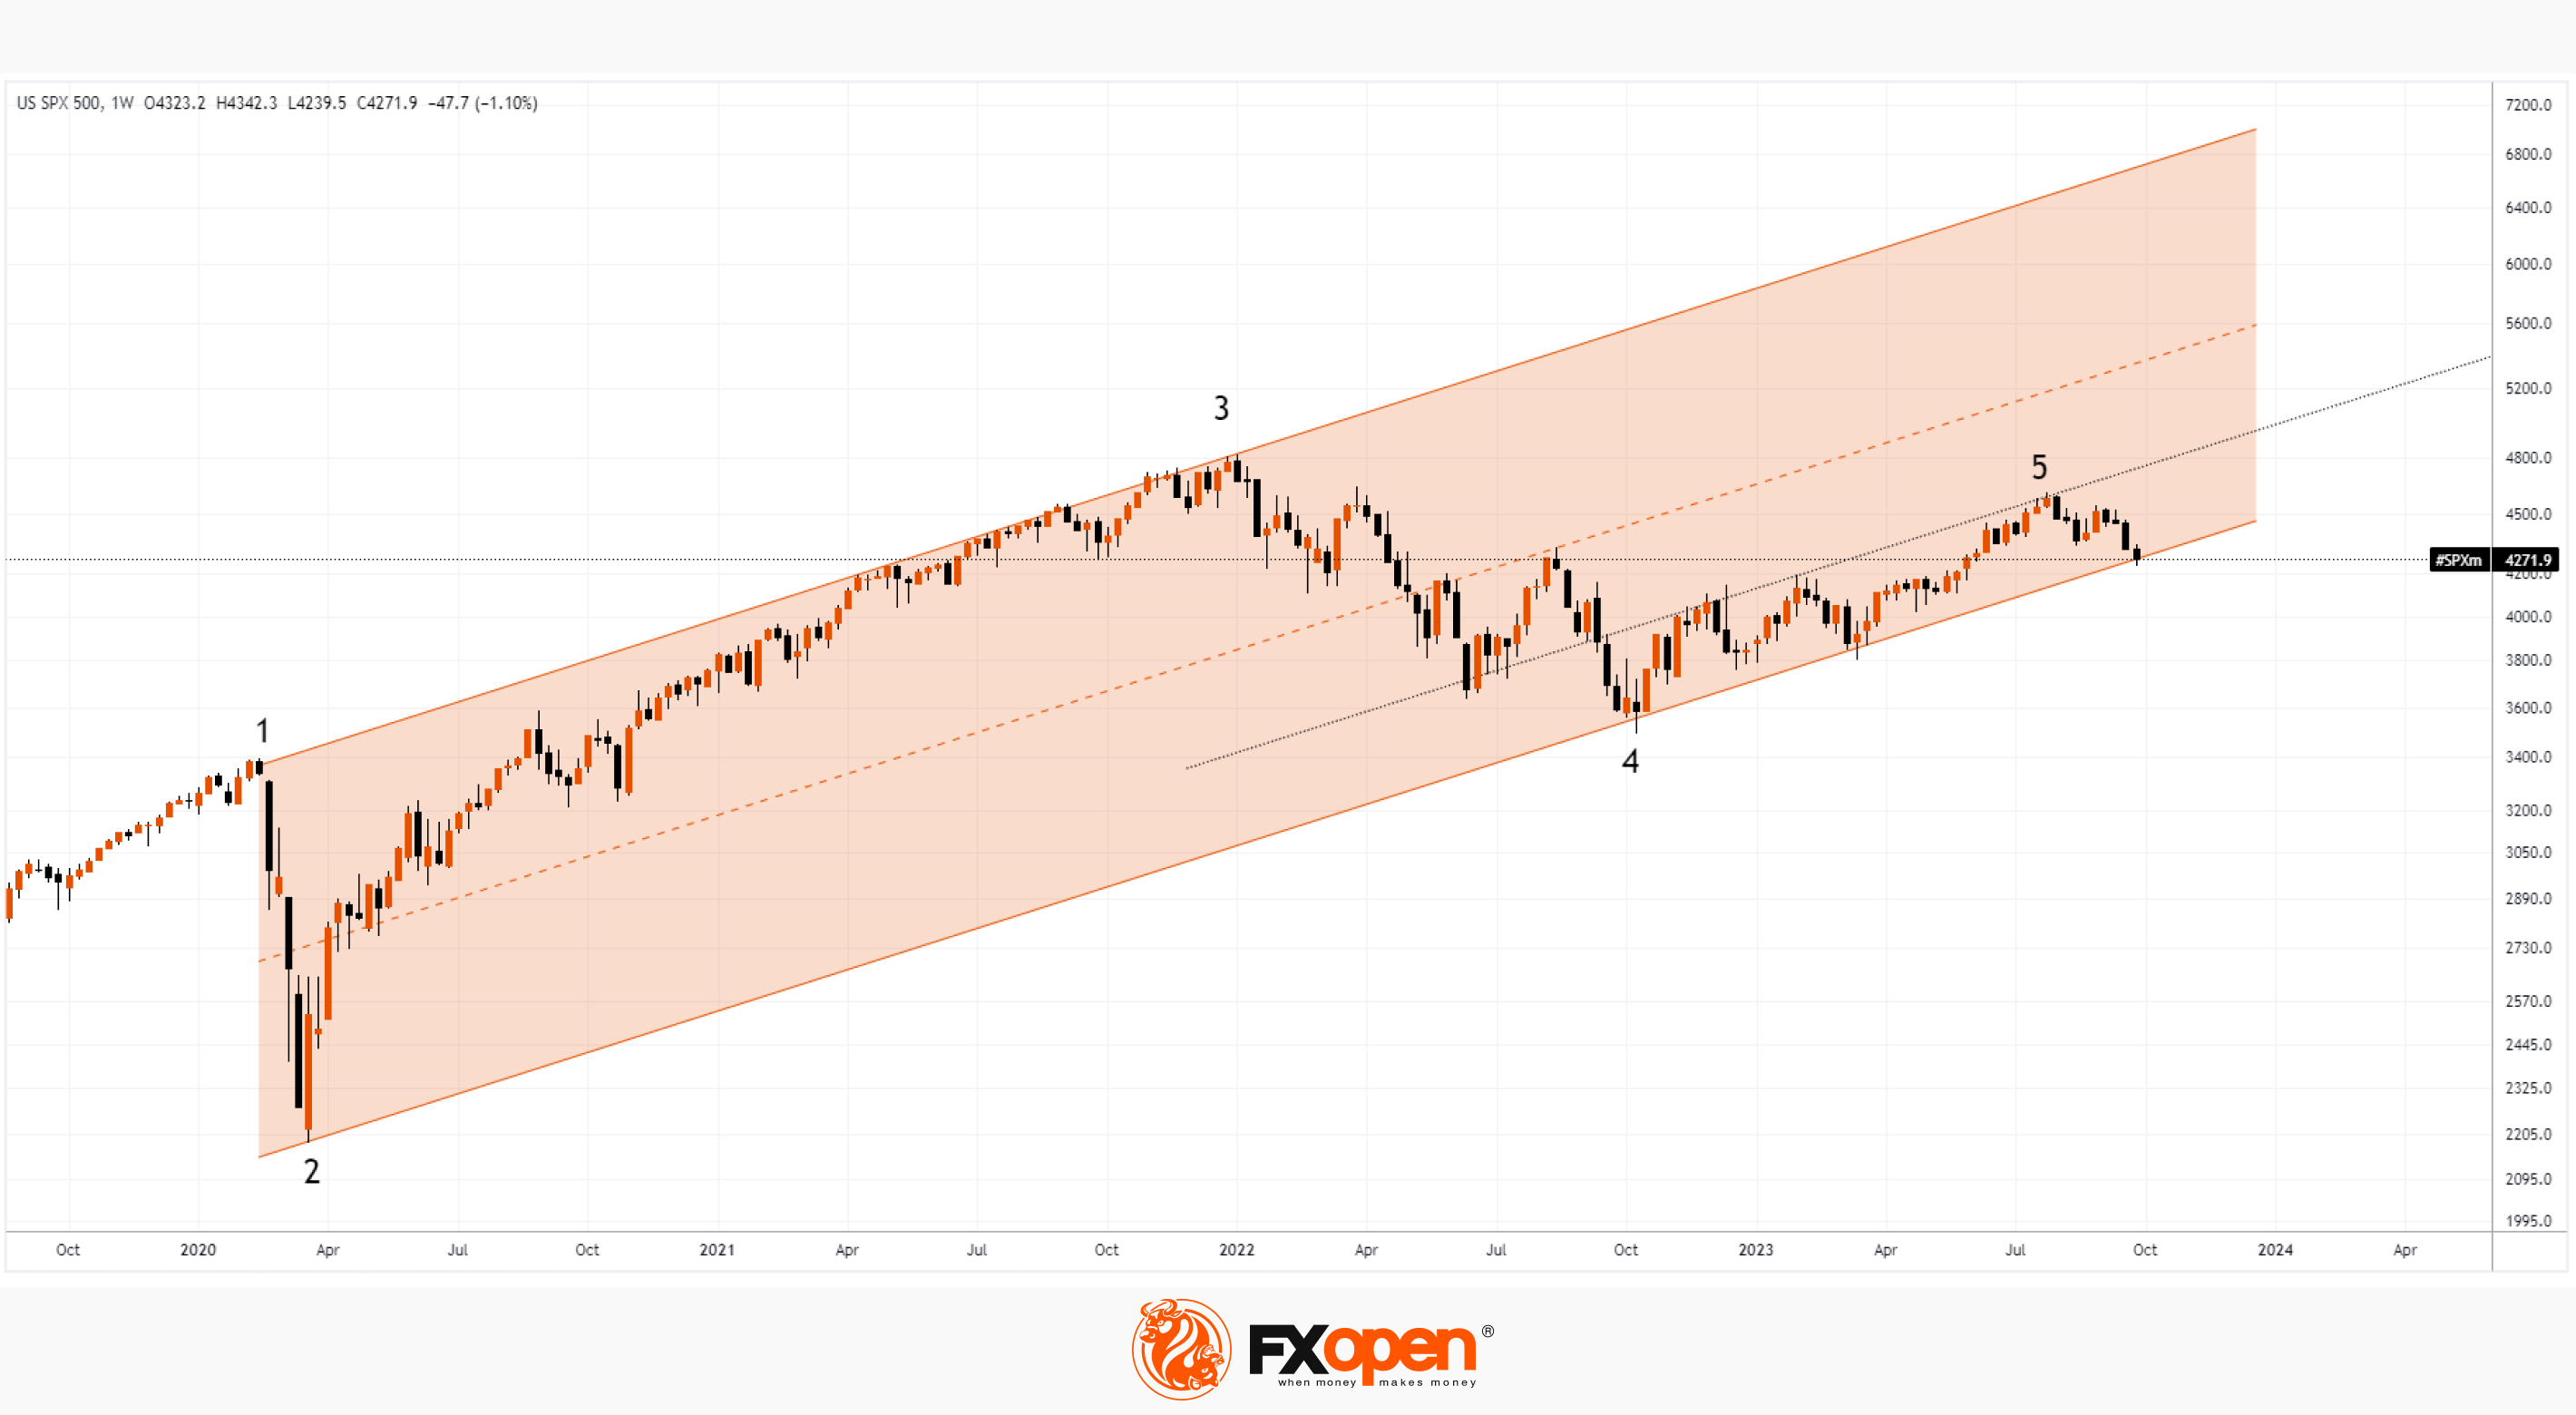
A threatening picture can be observed on the weekly chart of the S&P 500, constructed with a logarithmic price scale. Price dynamics form an important long-term channel that takes into account the beginning (1) and the bottom (2) of the coronavirus panic; historical maximum (3); bottom 2022 (4); the current maximum of 2023 (5), as well as a series of intermediate extremes. Note that the price has approached the lower border of the channel.
On the one hand, this can be regarded as a bullish argument — it is possible that the price will find support from the lower border (as was the case, for example, in March).
On the other hand, what if negative scenarios come true with a government shutdown, a further increase in inflation due to high prices, and a fall in the labour market? Epithets with “falling into the abyss” suggest themselves.
Today at 15:30 GMT+3, US GDP data and news from the labor market will be published. Be prepared for spikes in volatility.
Trade global index CFDs with zero commission and tight spreads (additional fees may apply). Open your FXOpen account now or learn more about trading index CFDs with FXOpen.
This article represents the opinion of the Companies operating under the FXOpen brand only. It is not to be construed as an offer, solicitation, or recommendation with respect to products and services provided by the Companies operating under the FXOpen brand, nor is it to be considered financial advice.
Stay ahead of the market!
Subscribe now to our mailing list and receive the latest market news and insights delivered directly to your inbox.


Latest articles

USD/CAD Rises to a Two-Month High
Today, the USD/CAD currency pair climbed above the 1.3787 level for the first time since late January.
→ Demand for the US dollar is being supported by concerns over escalating tensions in the Middle East. Market participants are favouring

Alphabet (GOOGL) Shares Fall to 2026 Low
As the chart shows, Alphabet (GOOGL) shares have dropped to their lowest level of 2026, with trading closing well below the psychological $300 per share mark.
Why Have Alphabet (GOOGL) Shares Declined?
The bearish move is driven by a combination

FX Market Awaits Macro Data: EUR/USD and GBP/USD Near Range Boundaries
European currencies are trading without a clear direction against the US dollar, remaining in a consolidation phase following the earlier decline driven by USD strength. At the start of the week, both EUR/USD and GBP/USD attempted a recovery,