


S&P 500 Index: Early December Chart Analysis
FXOpen

December is traditionally a favourable month for the S&P 500 (US SPX 500 mini on FXOpen):
→ Since the 1950s, December has ended higher in over 70% of years.
→ Average monthly gain is around +1.0%.
Will the index rise in 2025? Much depends on the Federal Reserve meeting on 10 December, as well as other factors, including geopolitical developments. Interest is also piqued by an upcoming statement from Trump at the White House (today, 22:00 GMT+3), though the topic remains undisclosed.
Technical Analysis of the S&P 500 Chart
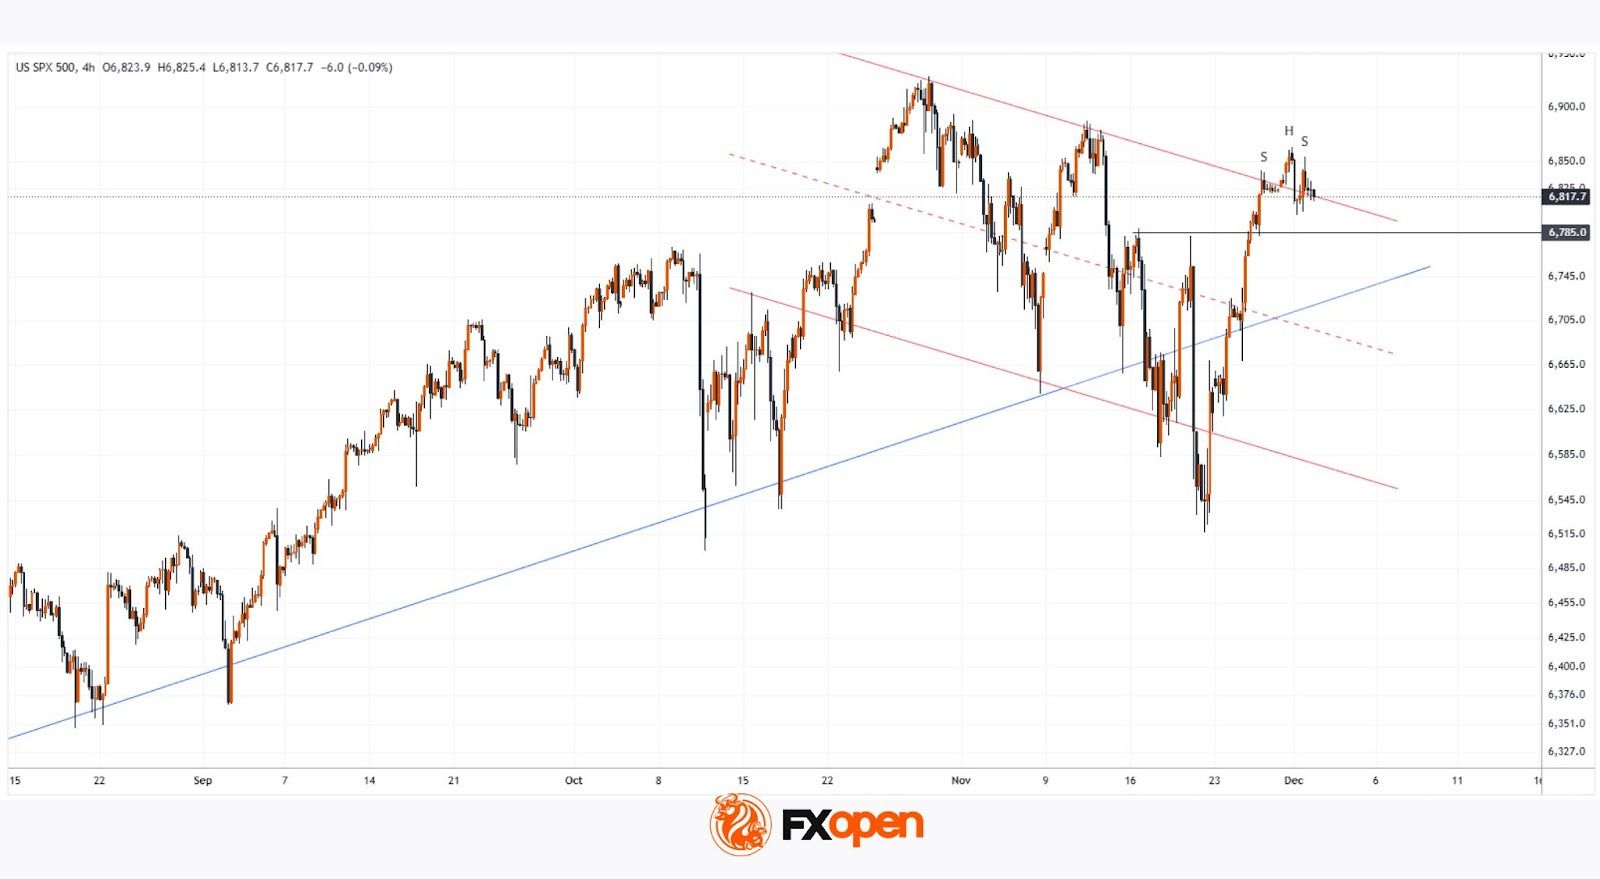
Demand-side perspective:
→ The rebound from November’s low was aggressive, rising roughly +5% in 10 days.
→ Price climbed above the blue trendline that has acted as support since summer.
→ The recent dip (marked by the red trajectory) could be a temporary correction, forming a Bull Flag pattern.
Supply-side perspective:
→ The red trajectory has not yet been breached.
→ Recent price movements show a strong bearish Head and Shoulders pattern, along with signs of a Quasimodo formation, emerging around the attempt to break the upper boundary.
In the short term, the former resistance at 6785 may now act as support. Overall, the S&P 500 (US SPX 500 mini on FXOpen) is likely to adopt a wait-and-see stance, adjusting as economic news, delayed by the government shutdown, is released.
Trade global index CFDs with zero commission and tight spreads (additional fees may apply). Open your FXOpen account now or learn more about trading index CFDs with FXOpen.
This article represents the opinion of the Companies operating under the FXOpen brand only. It is not to be construed as an offer, solicitation, or recommendation with respect to products and services provided by the Companies operating under the FXOpen brand, nor is it to be considered financial advice.
Stay ahead of the market!
Subscribe now to our mailing list and receive the latest market news and insights delivered directly to your inbox.


Latest articles

Pound Weakens After Soft UK Inflation Data as Euro Awaits Fresh Market Signals
The pound remains under pressure following the release of weaker-than-expected UK inflation data. The slowdown in inflation has strengthened expectations that the Bank of England could adopt a more accommodative policy stance in the coming months, weighing on sterling. Meanwhile,

Alphabet: Record Profit as Markets Await Their Verdict
On 22 July, Alphabet reported its Q2 2026 results, with revenue rising 24% year-on-year to $119.8 billion. Google Cloud revenue surged 82% to $24.77 billion, comfortably exceeding analysts' expectations. Search advertising generated $63.3 billion in revenue (+17%

NZD/USD Analysis: A Tug-of-War at the Critical Level
The kiwi has strengthened meaningfully against most peers this month. However, against the US dollar specifically, NZD/USD remains well below its 2026 highs, trading in the mid-0.58 area versus January's peak near 0.6075.
New Zealand's Q2 inflation