


Silver Price: October Kicks Off with a 14-Year High
FXOpen

As the XAG/USD chart shows, today silver prices climbed above the $47.50 per ounce mark for the first time since 2011. Since the beginning of the month, silver has appreciated by approximately 15%.
Why is silver rising?
According to media reports, demand for so-called safe-haven assets has intensified amid the US government shutdown, which officially began on 1 October. President Trump has placed the blame on Democrats, while maintaining optimism that the shutdown could be leveraged to streamline the work of federal agencies.
Trading Economics further highlights that the Silver Institute forecasts a deficit in the global silver market. Production is expected at 844 million ounces – around 100 million ounces short of demand, which continues to be driven by the expansion of solar energy, consumer electronics, and data centres.
Technical analysis of the XAG/USD chart
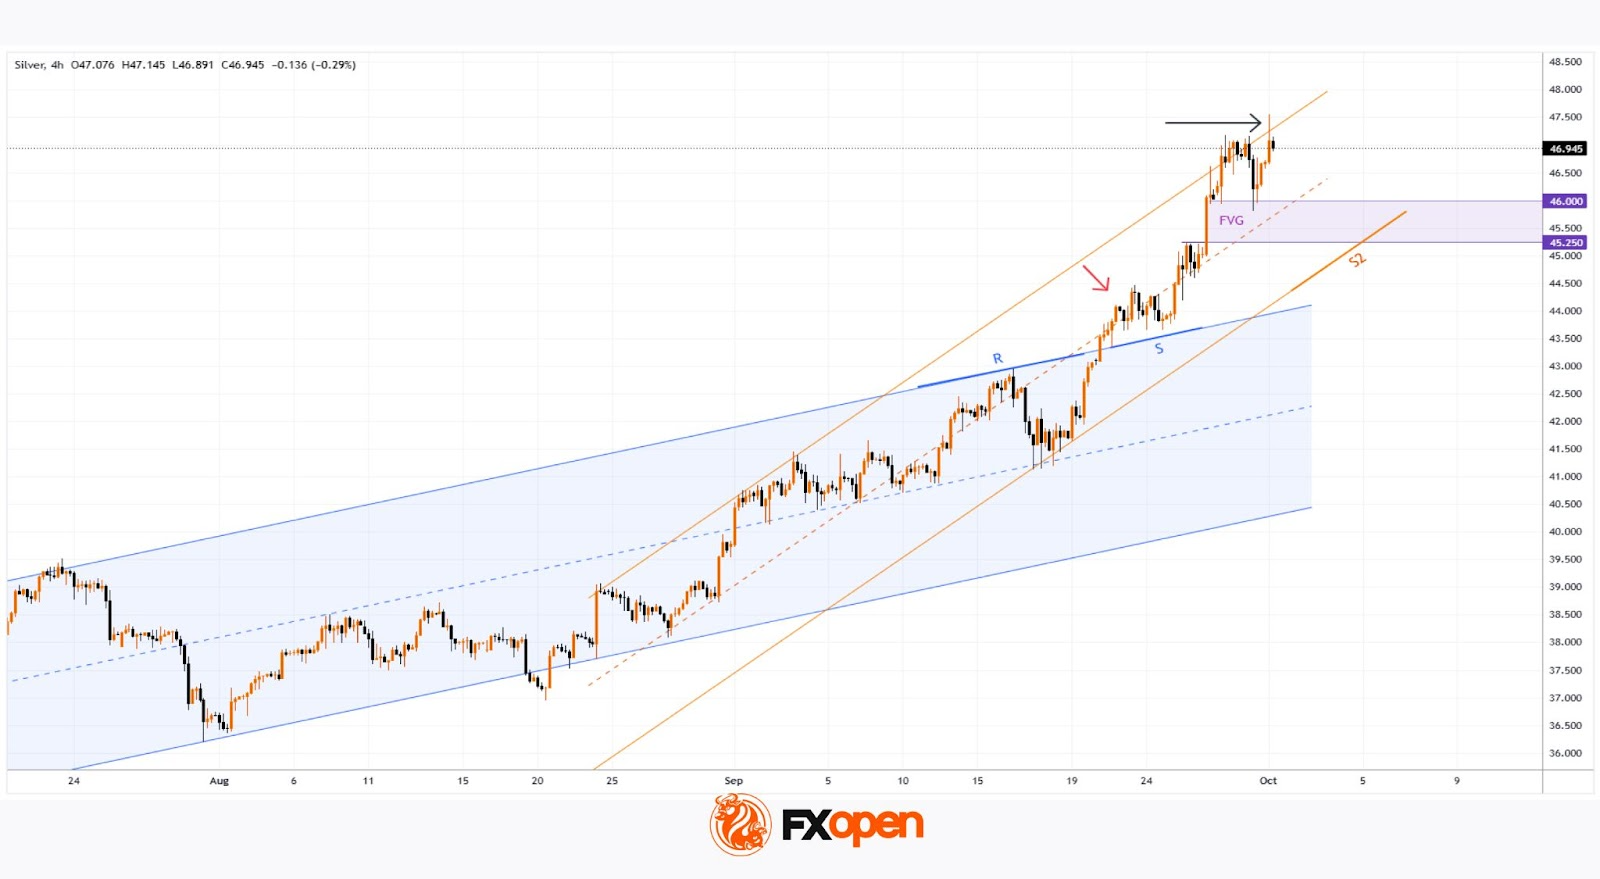
On 22 September, when analysing the XAG/USD chart, we:
→ Drew a long-term upward blue channel, along with a steeper orange channel indicating accelerated growth.
→ Noted that the silver price had broken above the upper boundary of the blue channel and suggested that XAG/USD was in a vulnerable position for a potential correction.
Shortly thereafter (as shown by the red arrow), the price encountered resistance. However, it was insufficient to trigger a pullback, as the upper boundary of the blue channel acted as support (S), allowing silver to continue its ascent within the orange channel.
Yesterday, when reviewing the gold chart, we noted a sharp decline in precious metals at the start of Monday’s session. Although bulls managed to recover during the US session (signalling robust demand), bears remain present – underscored by today’s failure to hold above Monday’s high (marked by the black arrow).
Applying any oscillator (such as RSI) will likely reveal signs of bearish divergence, pointing to a weakening bullish momentum.
Taking the above into account, we could assume that:
→ The market remains bullish. While demand forces may be losing steam, the momentum of the rally could continue to play a significant role.
→ A correction is possible – for example, towards the lower boundary of the orange channel (S2), which is reinforced by a bullish FVG (an imbalance zone favouring buyers).
Start trading commodity CFDs with tight spreads (additional fees may apply). Open your trading account now or learn more about trading commodity CFDs with FXOpen.
This article represents the opinion of the Companies operating under the FXOpen brand only. It is not to be construed as an offer, solicitation, or recommendation with respect to products and services provided by the Companies operating under the FXOpen brand, nor is it to be considered financial advice.
Stay ahead of the market!
Subscribe now to our mailing list and receive the latest market news and insights delivered directly to your inbox.


Latest articles

NZD/USD Analysis: A Tug-of-War at the Critical Level
The kiwi has strengthened meaningfully against most peers this month. However, against the US dollar specifically, NZD/USD remains well below its 2026 highs, trading in the mid-0.58 area versus January's peak near 0.6075.
New Zealand's Q2 inflation

AUD/USD and USD/CAD React to Rising Geopolitical Risks
Commodity-linked currencies remain under pressure as geopolitical tensions in the Middle East continue to escalate. The United States has maintained strikes on targets in Iran, while the Tehran-backed Houthis have intensified threats to shipping in the Red Sea and near

GBP/CHF: Trendline or RSI — Which One Is Lying?
Sterling enters this week on firmer footing, with political uncertainty fading fast after Andy Burnham's confirmation as Labour leader eased investor concerns over the succession to Keir Starmer. Markets reacted further to reports pointing to Shabana Mahmood as the frontrunner