


FXOpen

The previous peak was set in 1980, but this week the price of silver rose above $53 for the first time ever, as shown on the XAG/USD chart.
Bullish sentiment has been driven by political factors, sustained demand from central banks, and the metal’s growing use in modern industries such as renewable energy.
Meanwhile, media reports are adding to the sense of market frenzy, noting:
→ shortages in physical supply;
→ forced liquidation of short positions (the “short squeeze” effect);
→ bold analyst forecasts — with a CNBC survey suggesting silver could double from current levels to reach $100.
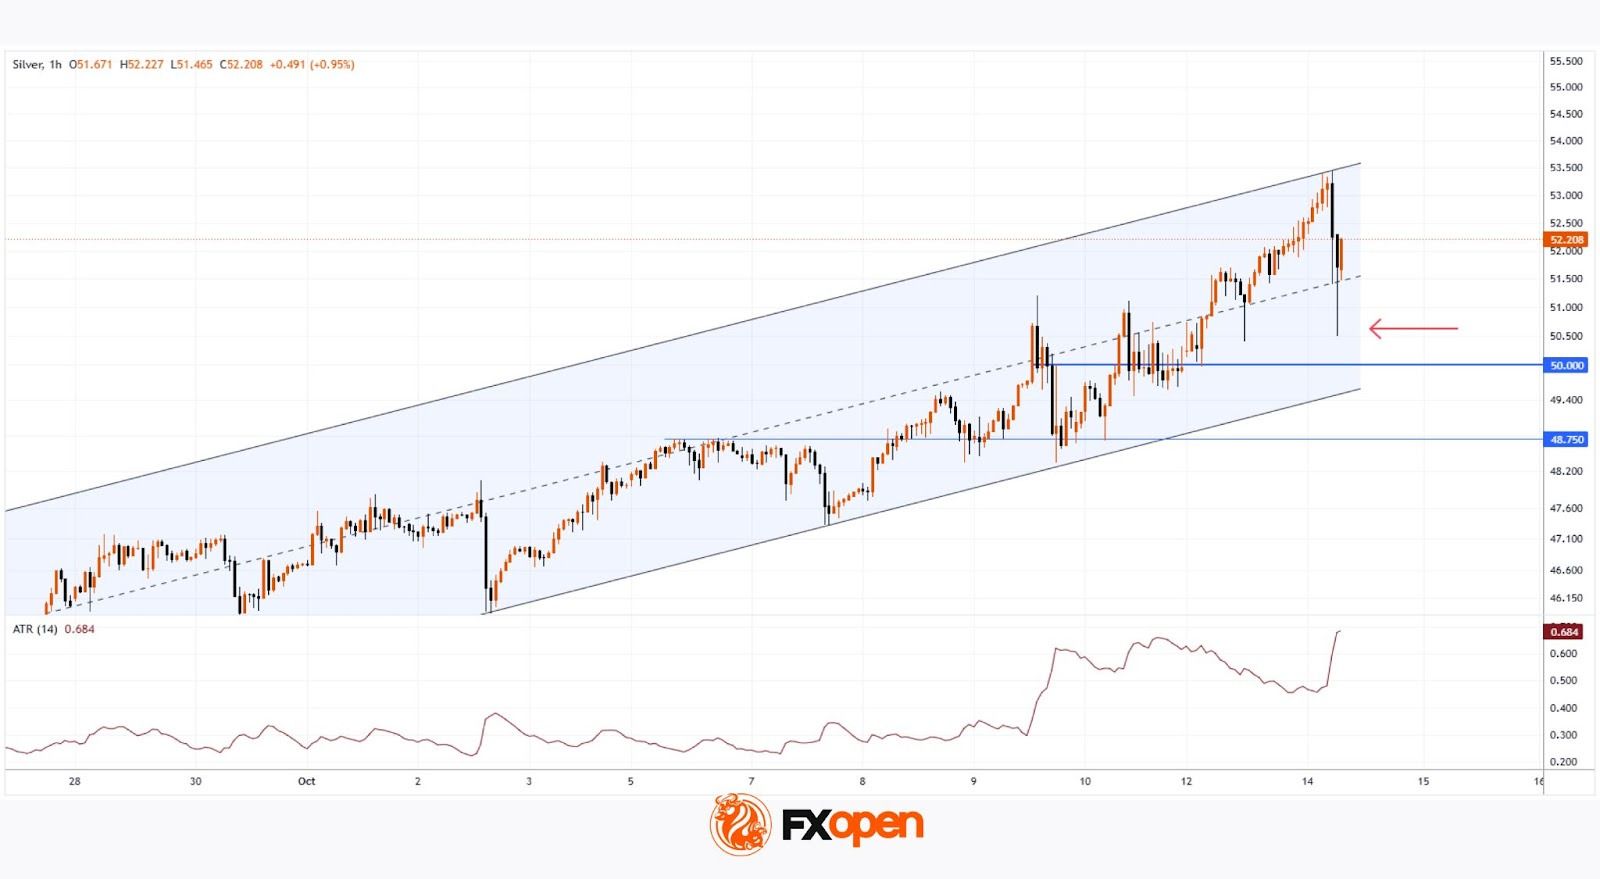
Technical Analysis of the XAG/USD Chart
In earlier analysis of the XAG/USD chart, we:
→ identified an upward channel;
→ noted that silver’s rise was slowing around the $48.75 level, though new record highs in gold could spur the “silver bulls”.
That slowdown has proved to be merely a pause before a breakout to fresh 45-year highs. The ascending channel has maintained its slope but widened upward — notably, the current all-time high sits along the upper boundary of this expanded channel.
Key observations:
→ A sharp drop of more than 5% over the past two candles signals strong selling pressure, likely linked to profit-taking after a roughly 17% rise over the past 30 days.
→ Long lower wicks on the recent wide candles (as indicated by the arrow) show active buying interest.
→ The rise in the ATR indicator became evident as the market broke through the key psychological level of $50 per ounce.
The increase in volatility means traders may need to adjust their strategies — it can also signal that a market reversal could be nearing, as extreme price swings often mark the end of prolonged trends.
For now, however, demand remains strong enough to keep the market within its upward channel:
→ bulls are likely to view the $50–50.50 area as key support;
→ bears may look to reassert control if XAG/USD attempts to climb further above $53.
Start trading commodity CFDs with tight spreads (additional fees may apply). Open your trading account now or learn more about trading commodity CFDs with FXOpen.
This article represents the opinion of the Companies operating under the FXOpen brand only. It is not to be construed as an offer, solicitation, or recommendation with respect to products and services provided by the Companies operating under the FXOpen brand, nor is it to be considered financial advice.
Stay ahead of the market!
Subscribe now to our mailing list and receive the latest market news and insights delivered directly to your inbox.


Latest articles

Tesla (TSLA) Shares Surge Following Musk’s Announcements
According to the chart, Tesla (TSLA) shares had been under significant pressure since the start of 2026: from their December high, they had lost around 25% of their value. The main bearish drivers included:
→ Intense competition from Chinese automakers, particularly

XTI/USD Analysis: WTI Oil Prices Under Pressure from Trump’s Statements
Yesterday, following a false bullish breakout above the psychological $100 level, WTI crude prices fell sharply towards the $85 area. The primary driver of this rapid decline was comments made by the US President.
According to Donald Trump:
→ the United
