


FXOpen

The ATR indicator on the S&P 500’s 4-hour chart (US SPX 500 mini on FXOpen) currently shows a reduction in price volatility.
This drop in volatility can likely be attributed to:
→ The market having fully absorbed the impact of Trump’s recent presidential win;
→ No unexpected news from yesterday’s CPI report, which matched analysts’ inflation expectations.
Looking ahead, Morgan Stanley analysts believe the bull market could face challenges from:
→ A rise in treasury bond yields, potentially diverting investor funds;
→ A strengthening dollar, which could reduce export revenues for large companies;
→ Indicators suggesting stock valuations are becoming even more stretched.
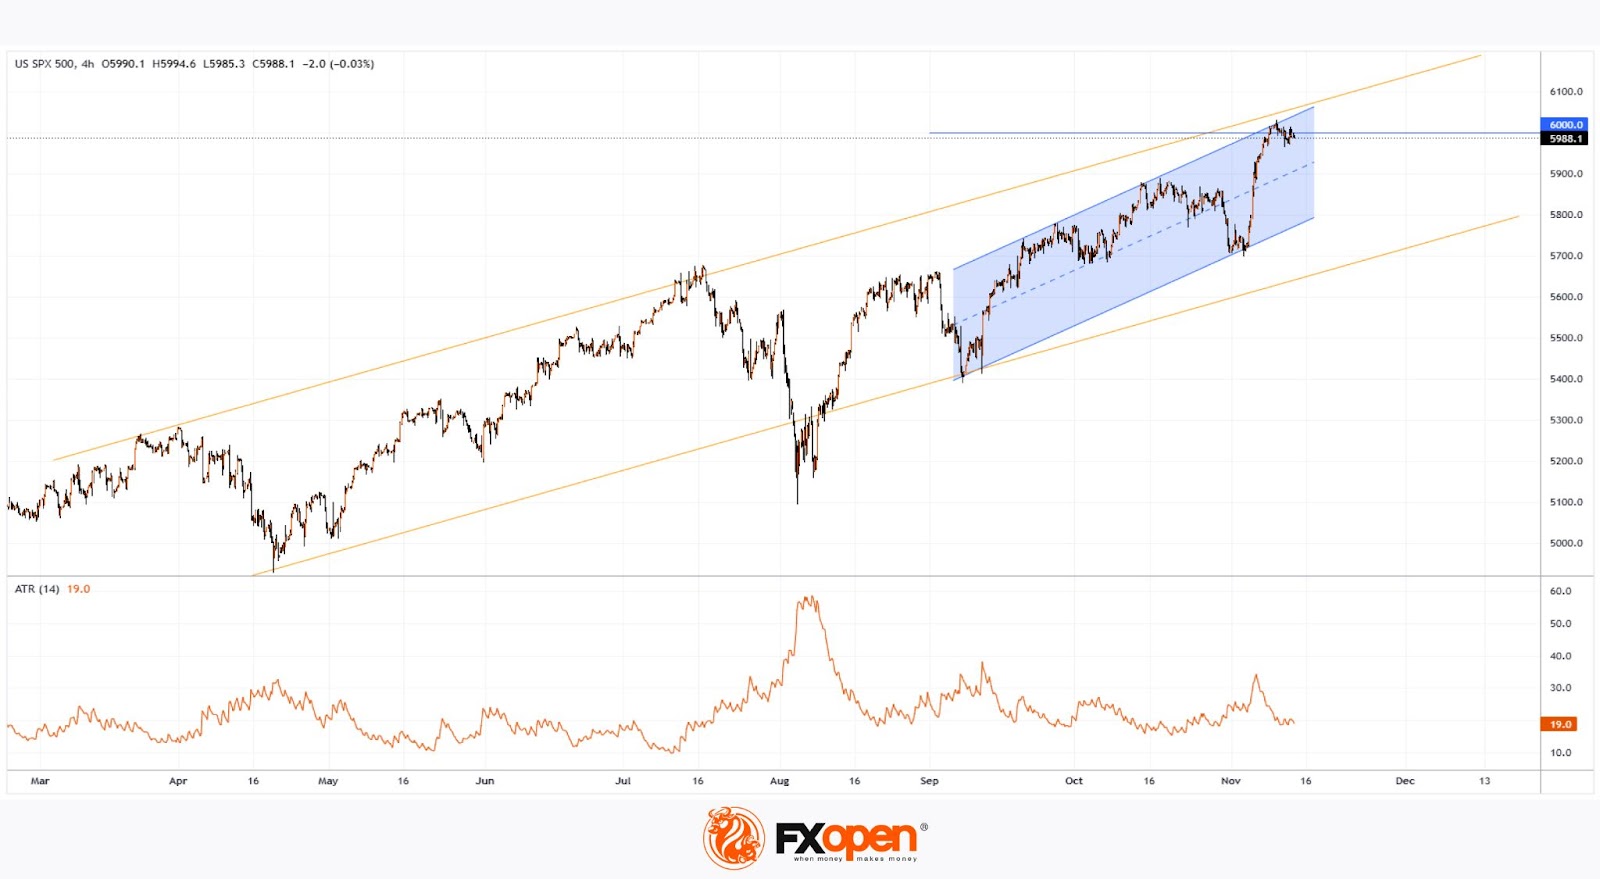
Technical analysis of the S&P 500 chart (US SPX 500 mini on FXOpen) highlights that price is at a resistance zone created by:
→ The upper boundary of the upward blue channel, which began in early September;
→ The upper edge of the long-term ascending channel (shown in orange, previously charted in our S&P 500 analysis on October 14);
→ The psychological level of 6,000 points.
Given these factors, it’s reasonable to anticipate that bulls may encounter difficulties if they attempt to push past the 6,000 level.
A potential pullback may emerge following the S&P 500's 4% rise since early November—perhaps towards the channel’s median or lower boundary.
Trade global index CFDs with zero commission and tight spreads (additional fees may apply). Open your FXOpen account now or learn more about trading index CFDs with FXOpen.
This article represents the opinion of the Companies operating under the FXOpen brand only. It is not to be construed as an offer, solicitation, or recommendation with respect to products and services provided by the Companies operating under the FXOpen brand, nor is it to be considered financial advice.
Stay ahead of the market!
Subscribe now to our mailing list and receive the latest market news and insights delivered directly to your inbox.


Latest articles

Market Analysis: GBP/USD Dips Further As EUR/GBP Regains Traction
GBP/USD failed to climb above 1.3500 and corrected some gains. EUR/GBP started a decent increase and might aim for more gains above 0.8700.
Important Takeaways for GBP/USD and EUR/GBP Analysis Today
· The British Pound


Market Insights with Gary Thomson: Oil, US Retail Sales & NFP in Focus
In this video, we’ll explore the key economic events and market trends, shaping the financial landscape. Get ready for insights into financial markets to help you navigate the week ahead. Let’s dive in!
In this episode of Market