


FXOpen

The chart for Tesla (TSLA) shares reveals:
→ At the beginning of December, the price was around $350;
→ Yesterday, the trading session closed above $420, surpassing the previous all-time high near $410 set in 2021.
The primary driver of this bullish sentiment appears to be the partnership between Elon Musk and Donald Trump. Since the 5 November election, Tesla shares have broken through a key resistance level near $265, rising approximately 69% and adding around $555 billion to the company’s market value.
Additional positive factors include:
→ Investor expectations that Tesla’s planned affordable new model could become a bestseller in 2025;
→ The company’s plans to launch self-driving taxis and other innovations.
Can the Bullish Momentum Persist?
According to Barron’s, Tesla shares might be overvalued from a fundamental perspective. Currently, TSLA trades at roughly 125 times the expected earnings for 2025, a ratio reminiscent of the previous peak when the stock dropped by about 50% in 2022.
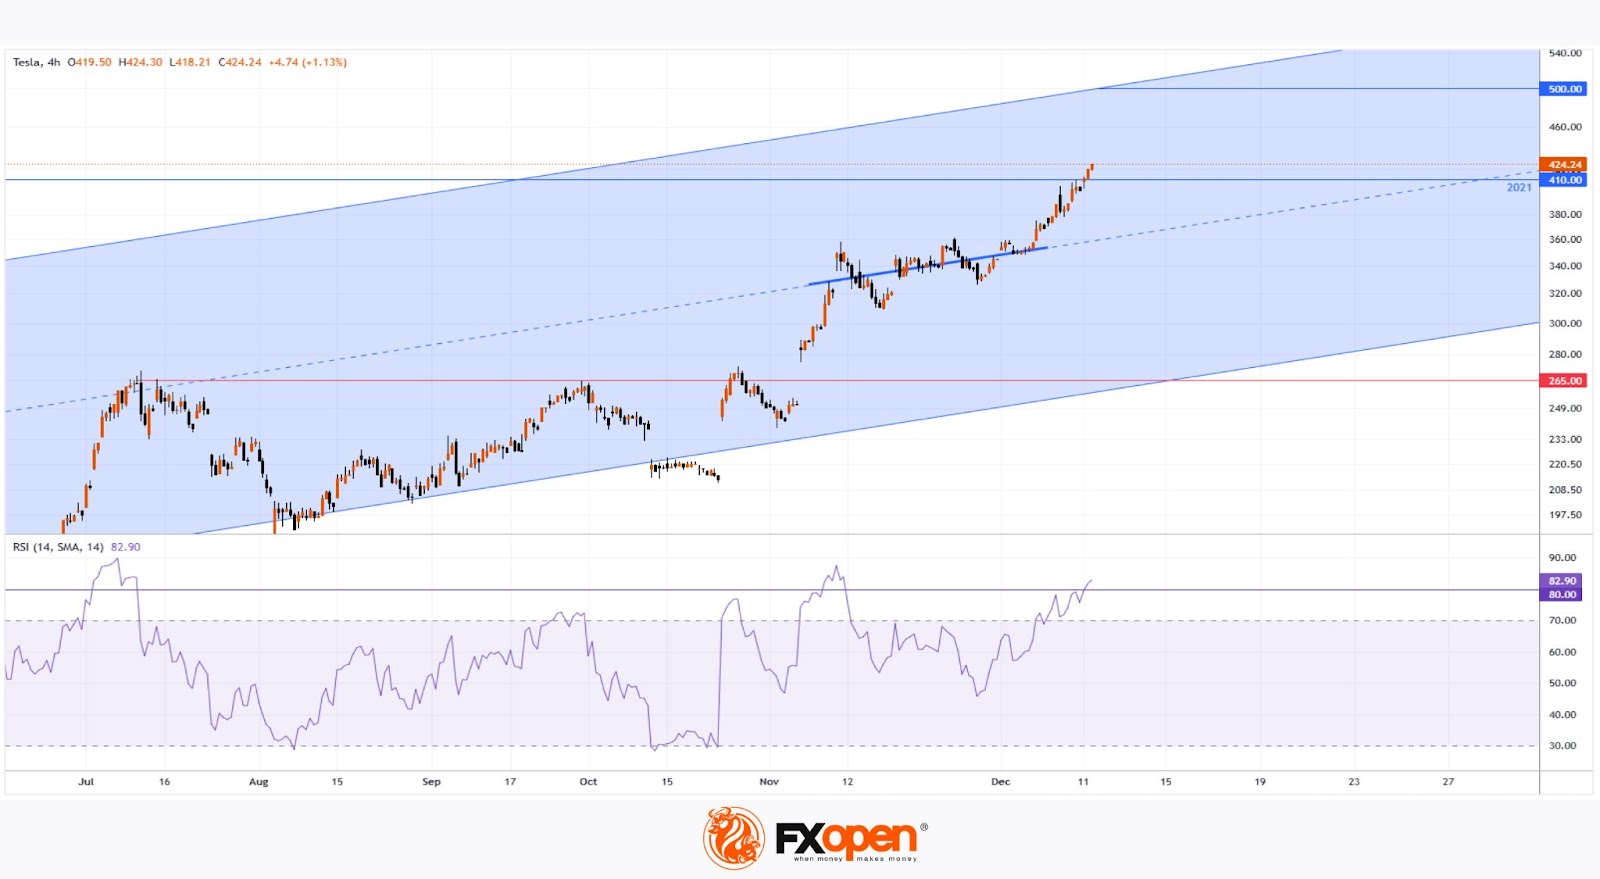
Technical Analysis of Tesla (TSLA) Shares
→ The November consolidation around $350 (marked by a thick blue line) may indicate the median of the long-term upward channel (shaded blue).
→ Throughout 2024, the lower boundary of this blue channel has provided strong support. In the most optimistic scenario, TSLA shares could rise toward the channel’s upper boundary near the psychological $500 level.
→ The RSI indicator is above 80, suggesting the price is vulnerable to a pullback, as observed earlier this year. In this scenario, a test of the $400 psychological level cannot be ruled out.
For a more detailed analysis of Tesla’s potential future price trajectory, see the analytical TSLA stock forecasts for 2025 – 2030 and beyond.
Buy and sell stocks of the world's biggest publicly-listed companies with CFDs on FXOpen’s trading platform. Open your FXOpen account now or learn more about trading share CFDs with FXOpen.
This article represents the opinion of the Companies operating under the FXOpen brand only. It is not to be construed as an offer, solicitation, or recommendation with respect to products and services provided by the Companies operating under the FXOpen brand, nor is it to be considered financial advice.
Stay ahead of the market!
Subscribe now to our mailing list and receive the latest market news and insights delivered directly to your inbox.


Latest articles

Market Analysis: GBP/USD Dips Further As EUR/GBP Regains Traction
GBP/USD failed to climb above 1.3500 and corrected some gains. EUR/GBP started a decent increase and might aim for more gains above 0.8700.
Important Takeaways for GBP/USD and EUR/GBP Analysis Today
· The British Pound


Market Insights with Gary Thomson: Oil, US Retail Sales & NFP in Focus
In this video, we’ll explore the key economic events and market trends, shaping the financial landscape. Get ready for insights into financial markets to help you navigate the week ahead. Let’s dive in!
In this episode of Market