


FXOpen

The escalation in the Middle East has led to a drop in some high-risk financial assets, including Bitcoin. According to the BTC/USD chart, Bitcoin's price is currently just above $60k, though less than a week ago, the bulls were pushing towards $66k.
Sentiment has also been dampened by the US Securities and Exchange Commission’s (SEC) decision to appeal a July 2023 ruling that XRP does not meet the legal definition of a security (XRP/USD fell by around 10% in a day).
Investor caution is further evident in the data showing capital outflows from Bitcoin ETF funds.
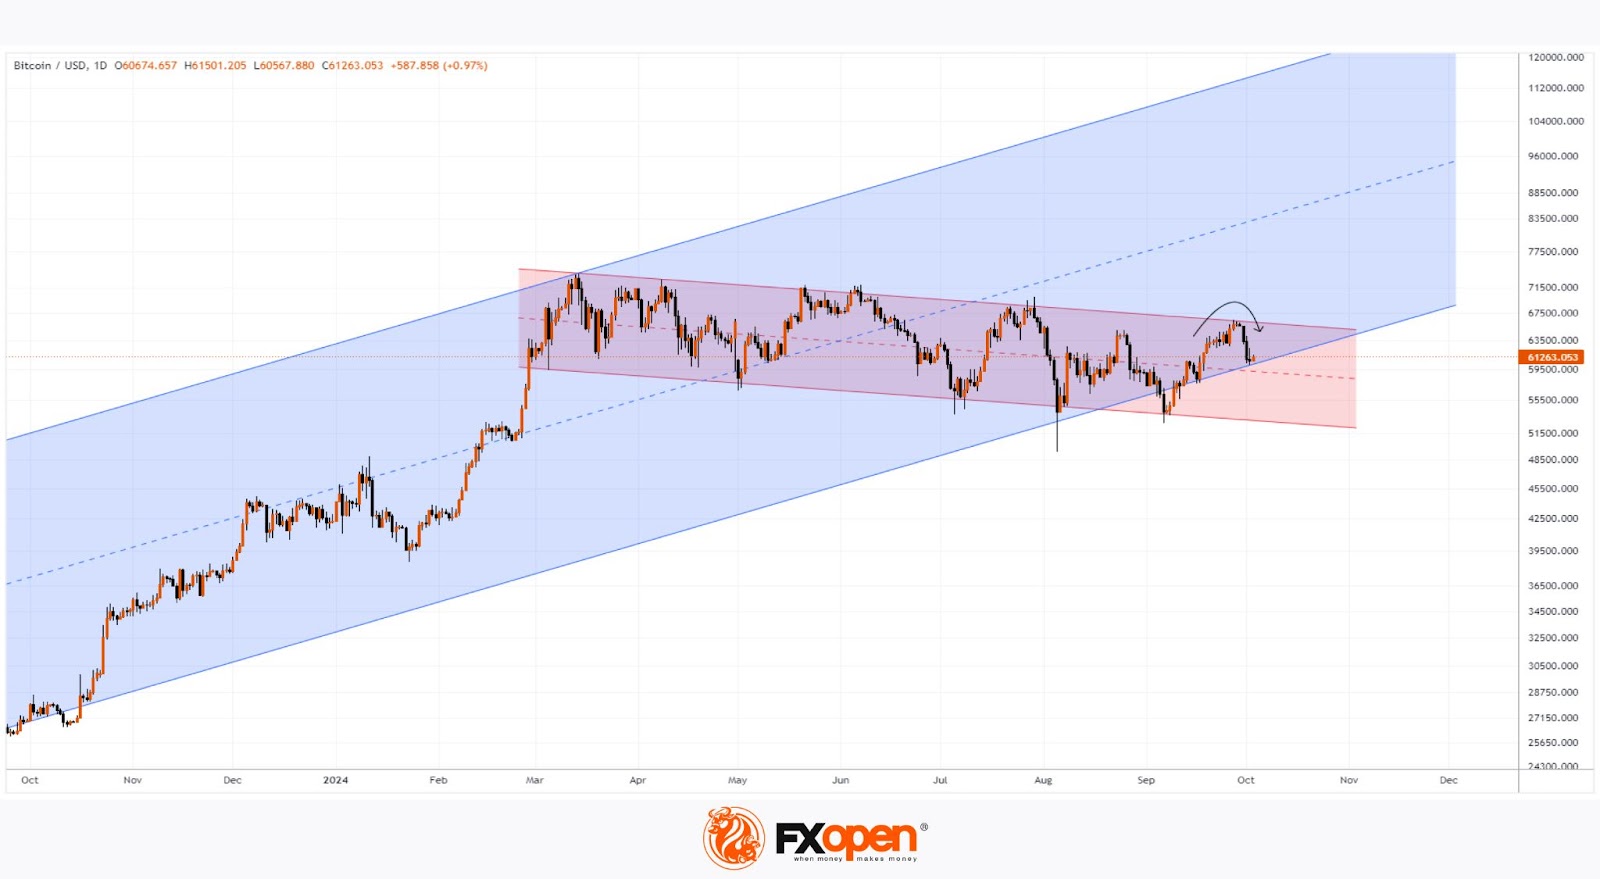
Technical analysis of the BTC/USD chart today indicates that, from a long-term perspective, BTC/USD is moving within an ascending channel, shown in blue (as mentioned in our previous Bitcoin price analysis on 23 September), with the following key points:
→ Everything that has happened to the price since March can be viewed as a correction (shown by the red channel) within a bullish trend, forming a bullish flag pattern.
→ The bearish reversal at the start of this month (marked with an arrow) highlights the significance of resistance from the upper boundary of the red channel.
At Bitcoin’s current price level, its proximity to the lower boundary of the blue channel is crucial. A bearish acceleration here would be a worrying signal, suggesting a potential break of the long-standing upward trend that has been in place for several months.
FXOpen offers the world's most popular cryptocurrency CFDs*, including Bitcoin and Ethereum. Floating spreads, 1:2 leverage — at your service. Open your trading account now or learn more about crypto CFD trading with FXOpen.
*Important: At FXOpen UK, Cryptocurrency trading via CFDs is only available to our Professional clients. They are not available for trading by Retail clients. To find out more information about how this may affect you, please get in touch with our team.
This article represents the opinion of the Companies operating under the FXOpen brand only. It is not to be construed as an offer, solicitation, or recommendation with respect to products and services provided by the Companies operating under the FXOpen brand, nor is it to be considered financial advice.
Stay ahead of the market!
Subscribe now to our mailing list and receive the latest market news and insights delivered directly to your inbox.


Latest articles


XBR/USD Chart Analysis: Price Rebounds from a Seven-Week Low
On 1 December, we outlined a descending channel on the XBR/USD chart and noted that the bearish trend was driven by fading geopolitical risks. Indeed, hopes for an end to the war in Ukraine—along with the possibility of

Silver Price Hits Historic Record Around $64
On 27 November, we suggested that silver was preparing to challenge its all-time high. Since then (marked with the orange arrow), XAG/USD has risen by roughly 18%, breaking above the psychological $60-per-ounce threshold for the first time in history.