


The Price of Gold XAU/USD Sets a Historical Record Exceeding $2160 per Ounce
FXOpen

The previous high was around USD 2,135, but gold rose above USD 2,160 an ounce this morning, reaching its highest level ever, as Treasury yields weakened on hopes that the US Federal Reserve will soon begin cutting interest rates.
In a speech yesterday, the Fed chief offered no clarity, saying it would likely be appropriate to ease policy restrictions "at some point this year."
Traders now see a 70% chance of a Fed rate cut in June.
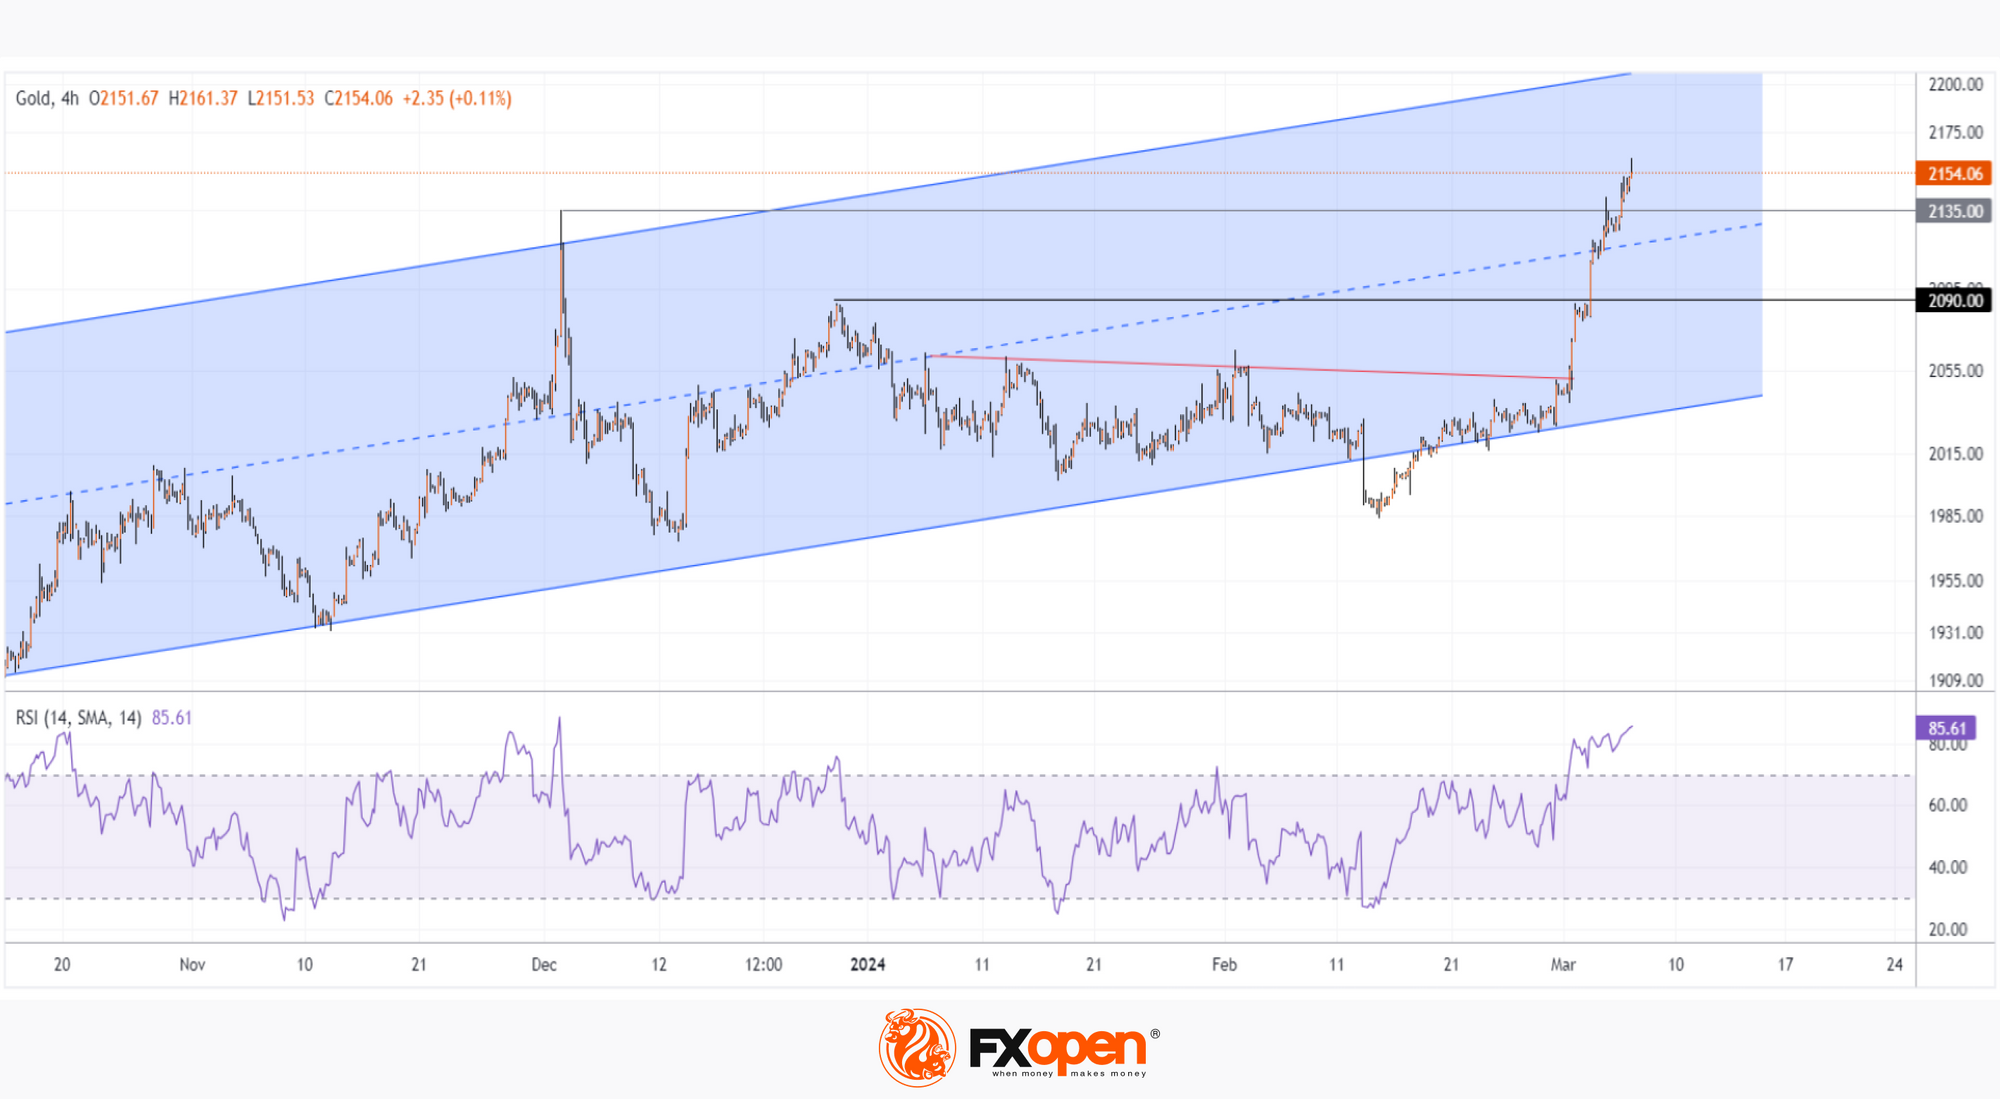
Technical analysis of the XAU/USD chart shows that:
→ the price of gold is in an ascending channel (shown in blue);
→ after a false breakout of its lower border, the price confidently overcame the downward trend line (shown in red) and resistance 2,090;
→ a strong upward impulse led to the RSI indicator entering the extreme overbought zone.
Although the blue ascending channel leaves room for growth to its upper limit, the rise in the price of gold by more than 5% since the first days of March leaves the market vulnerable to a correction — for instance, to the median line of the ascending channel.
James Steel, chief precious metals analyst at HSBC, also says that gold's upward trajectory may slow down. He believes record high prices could cool physical demand for the metal, especially from central banks.
Start trading commodity CFDs with tight spreads (additional fees may apply). Open your trading account now or learn more about trading commodity CFDs with FXOpen.
This article represents the opinion of the Companies operating under the FXOpen brand only. It is not to be construed as an offer, solicitation, or recommendation with respect to products and services provided by the Companies operating under the FXOpen brand, nor is it to be considered financial advice.
Stay ahead of the market!
Subscribe now to our mailing list and receive the latest market news and insights delivered directly to your inbox.


Latest articles

Ethereum: Has the Recovery Begun?
Ethereum has staged a notable rebound after once again testing the heavily watched psychological zone around 1500$. Since bouncing off this support, ETH/USD has climbed roughly 13%, now trading around the $1,700 mark.
This recovery is being driven

Oil Prices Are Back at Pre-Conflict Levels. Analysts Are Divided
At the start of May, oil markets were still pricing in elevated geopolitical risk and expectations of sustained supply disruption.
But easing tensions between Washington and Tehran, along with improving supply expectations, have rapidly shifted sentiment back toward fundamentals.
📉 Brent

The Dollar Awaits the Week’s Key Report: AUD/USD and NZD/USD at Crucial Technical Levels
Following mixed performance by the US dollar earlier this week, investors are now fully focused on the June Nonfarm Payrolls report, which will be released on Thursday rather than Friday. The schedule has been brought forward as US financial markets