


FXOpen

As shown on the XAU/USD chart, gold prices surpassed $2,800 per ounce for the first time in history on 31 January. However, by 3 February, we have seen a pullback from this record high.
Today’s bearish sentiment in gold is driven by the strengthening US dollar, a reaction from currency markets to the tariffs announced by Donald Trump.
This creates a mixed outlook:
→ On one hand, trade war concerns support gold as a safe-haven asset.
→ On the other, a stronger dollar pressures XAU/USD.
According to Reuters, Citi analysts suggest that further tariffs could drive gold prices up to $3,000 per ounce.
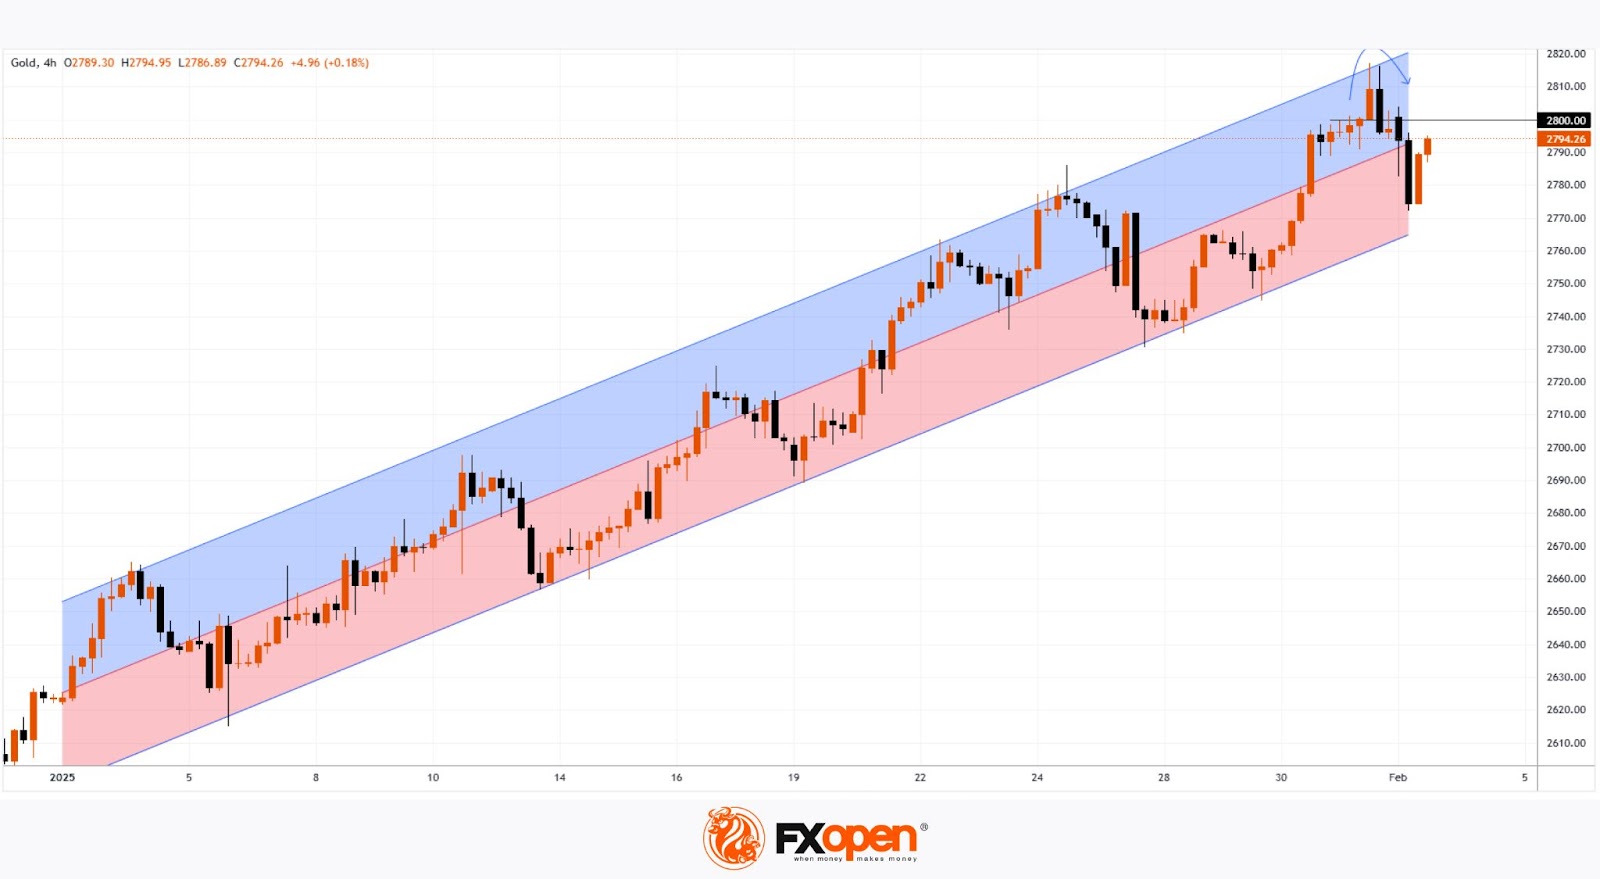
The technical analysis of the 4-hour XAU/USD chart shows that:
→ The price is moving within an upward trend, following a linear regression channel drawn from the first candles of 2025.
→ A bullish attempt to break above $2,800 triggered selling pressure, forming a bearish engulfing pattern and pushing the price towards the lower boundary of the channel. If fundamentals continue to support gold’s rise, the $2,800 level could become a significant resistance for the current trend throughout February.
Start trading commodity CFDs with tight spreads (additional fees may apply). Open your trading account now or learn more about trading commodity CFDs with FXOpen.
This article represents the opinion of the Companies operating under the FXOpen brand only. It is not to be construed as an offer, solicitation, or recommendation with respect to products and services provided by the Companies operating under the FXOpen brand, nor is it to be considered financial advice.
Stay ahead of the market!
Subscribe now to our mailing list and receive the latest market news and insights delivered directly to your inbox.


Latest articles

Iran Conflict and Economic Data: Events in Focus for 2-6 March
Let’s discuss three upcoming events that may impact market activity across currencies, equities, and commodities.
✔️Washington and Israel struck Iran, the supreme leader of Iran Ayatollah Khamenei was killed. Iran retaliated, escalating tensions.
Oil jumped over 8%, global stocks

WTI Oil Trading Opens with a 10% Bullish Gap
On Friday, we warned that trading on Monday could be volatile — but not to this extent! The situation sharply escalated over the weekend following a large-scale strike by Israel and the US on targets in Iran, during which the supreme

Geopolitical Shock: Gold Price Storms $5,400 After Attack on Iran
The reason is clear: confirmed US and Israeli strikes on targets in Iran, including reports of the death of Supreme Leader Ali Khamenei, have triggered renewed demand for safe-haven assets, pushing gold prices higher.
As of Monday morning, news of