


UK100 Share Index Rises as UK Inflation Slows
FXOpen
Yesterday, the UK Office for National Statistics (ONS) reported that the CPI stood at 3.2% in March. According to ForexFactory, analysts expected 3.1%, and a month ago the index was 3.4%.
Grant Fitzner, chief economist at the ONS, said: “Once again, food prices were the main reason for the fall, with prices rising by less than we saw a year ago. Similarly to last month, we saw a partial offset from rising fuel prices.”
Thus, actual inflation in the UK fell to its lowest level in two and a half years. According to Yahoo Finance, this weakening of inflation could influence the Bank of England to start cutting interest rates from the current level of 5.25% in June.
In anticipation of an easing of monetary policy, the values of the UK stock index UK100 increased yesterday. Today it is above the 7,900 level.
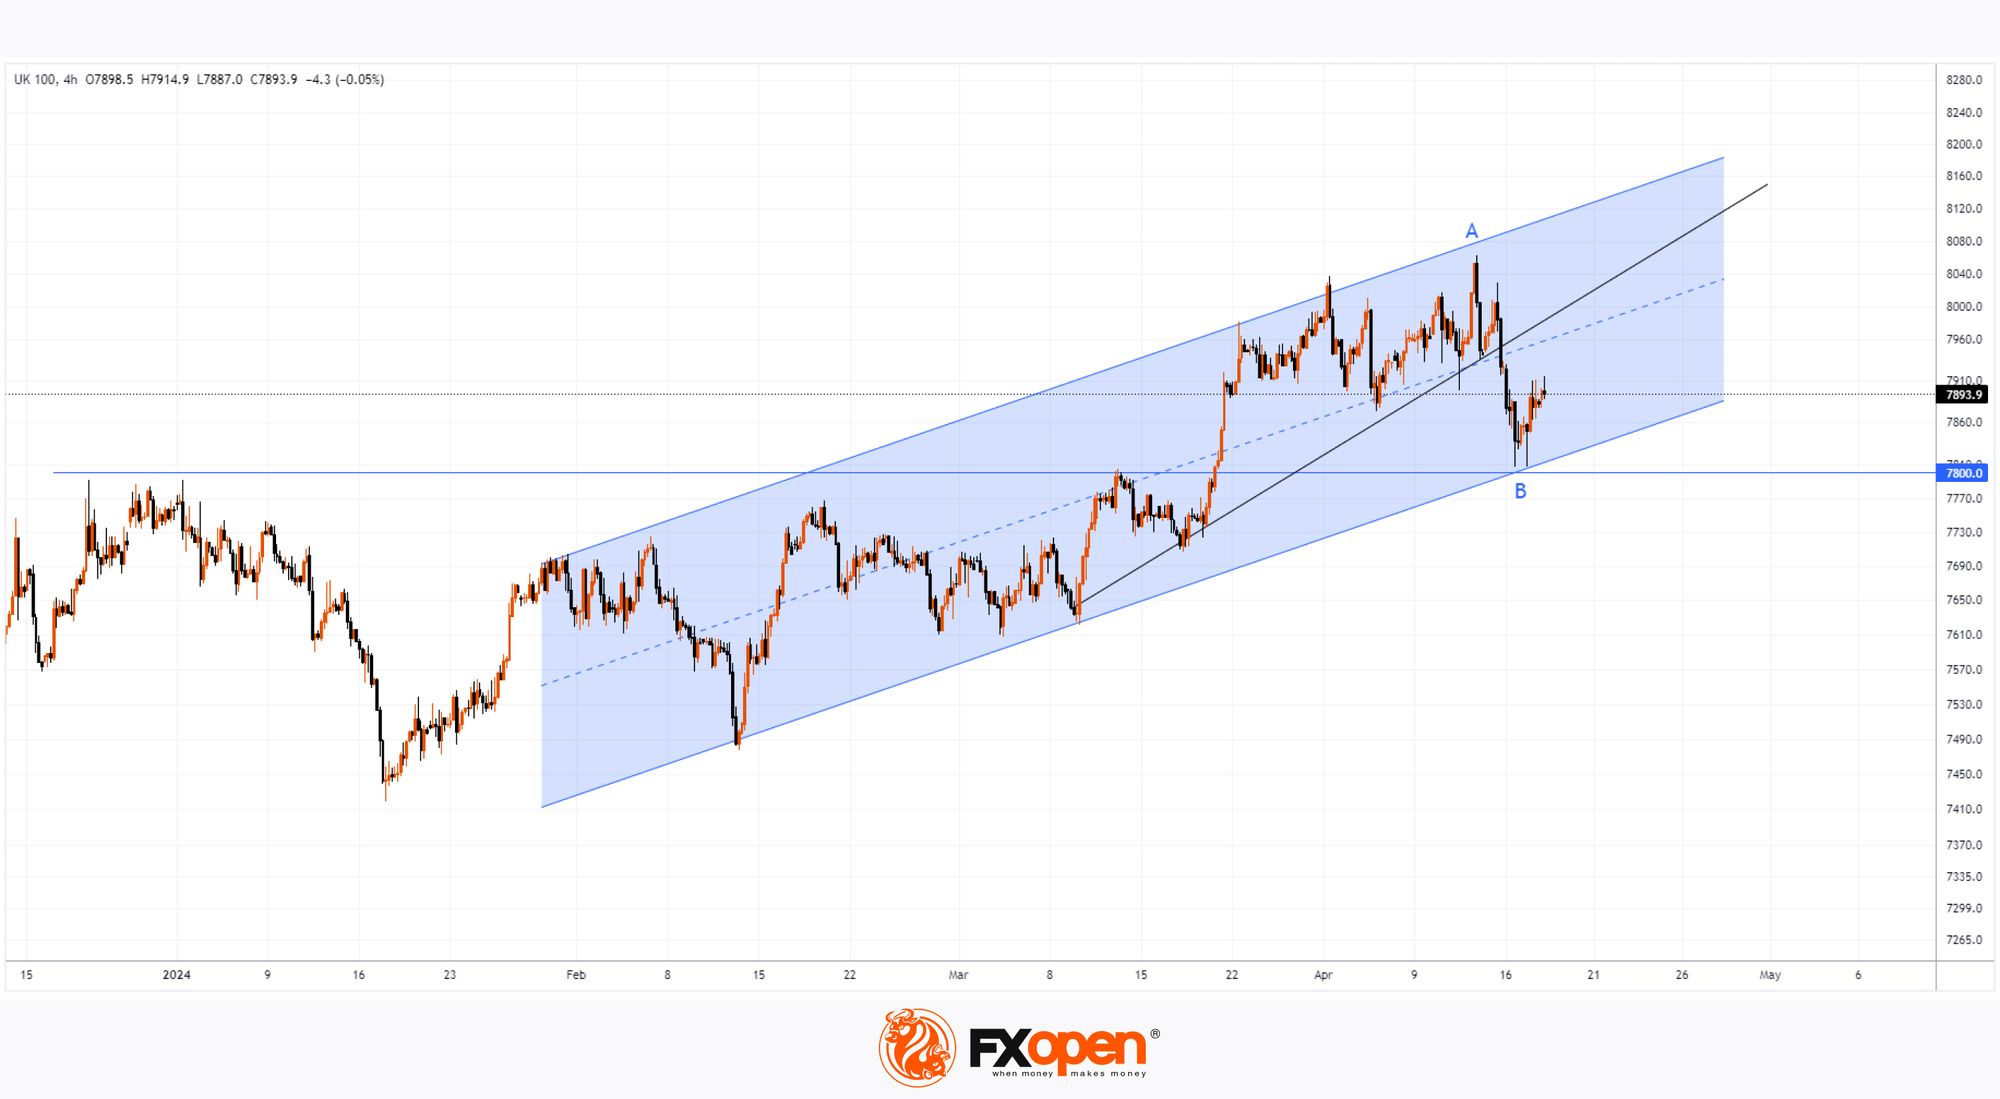
Technical analysis of the UK100 chart today shows that:
→ the price forms an ascending channel (shown in blue);
→ the rise in the price of UK100 from the current week’s low forms a rebound from the support block, which is formed by the lower border of this channel and the former resistance 7,800.
At the same time, the bearish arguments remain powerful:
→ pay attention to the sharp rate of decline in A→B;
→ the UK100 price has broken down the intermediate trend line (shown in black).
Will the market be able to resume the rally indicated by the blue channel? Important information about the seriousness of bullish sentiment in the UK stock market can be provided by the behavior of the UK100 price, namely its ability to rise above the median line of the channel and above the level of 50% of the decline (A→B).
Trade global index CFDs with zero commission and tight spreads (additional fees may apply). Open your FXOpen account now or learn more about trading index CFDs with FXOpen.
This article represents the opinion of the Companies operating under the FXOpen brand only. It is not to be construed as an offer, solicitation, or recommendation with respect to products and services provided by the Companies operating under the FXOpen brand, nor is it to be considered financial advice.
Stay ahead of the market!
Subscribe now to our mailing list and receive the latest market news and insights delivered directly to your inbox.


Latest articles

Weekly Market Insights with Gary Thomson: The Week of Central Banks and Earnings
In this video, we’ll explore the key economic events and market trends, shaping the financial landscape. Get ready for insights into financial markets to help you navigate the week ahead. Let’s dive in!
In this episode of Market

Intel at a Crossroads: Earnings Beat Meets Technical Resistance
Intel has just delivered its strongest quarter in over fifteen years, and the market reaction says it all. Q2 2026 revenue surged 25% year-over-year to $16.1 billion, crushing the consensus estimate of $14.42 billion, while adjusted EPS of

Tesla: Complex Range Structure Breaks Down Following Quarterly Earnings
Tesla released its Q2 2026 results after the market closed on 22 July. Revenue increased 26% year-on-year to $28.24 billion, while vehicle deliveries reached a record 480,126 units. However, operating margin fell sharply to 1.4%, down from