


USD/CAD Analysis: the Rate Approaching Important Support
FXOpen

Bank of Canada Governor Tiff Macklem said yesterday that enough may have been done to curb inflation. As follows from his words, current policies can lead to inflation returning to the target of 2%.
The announcement fueled market and economist expectations that interest rates had peaked. It is acceptable to assume that the Bank of Canada instilled confidence in market participants, and therefore the Canadian dollar strengthened yesterday relative to other currencies.
Including relative to USD. Yesterday, by the way, data on the number of unemployment applications was published. They did not bring any surprises - the labour market continues to remain strong in the US (the actual number of applications was = 209k for the week, expected = 226k, a week ago = 233k). The news gave a reason to strengthen the USD, but overall the US dollar index is in a downward trend amid expectations of easing Fed policy.
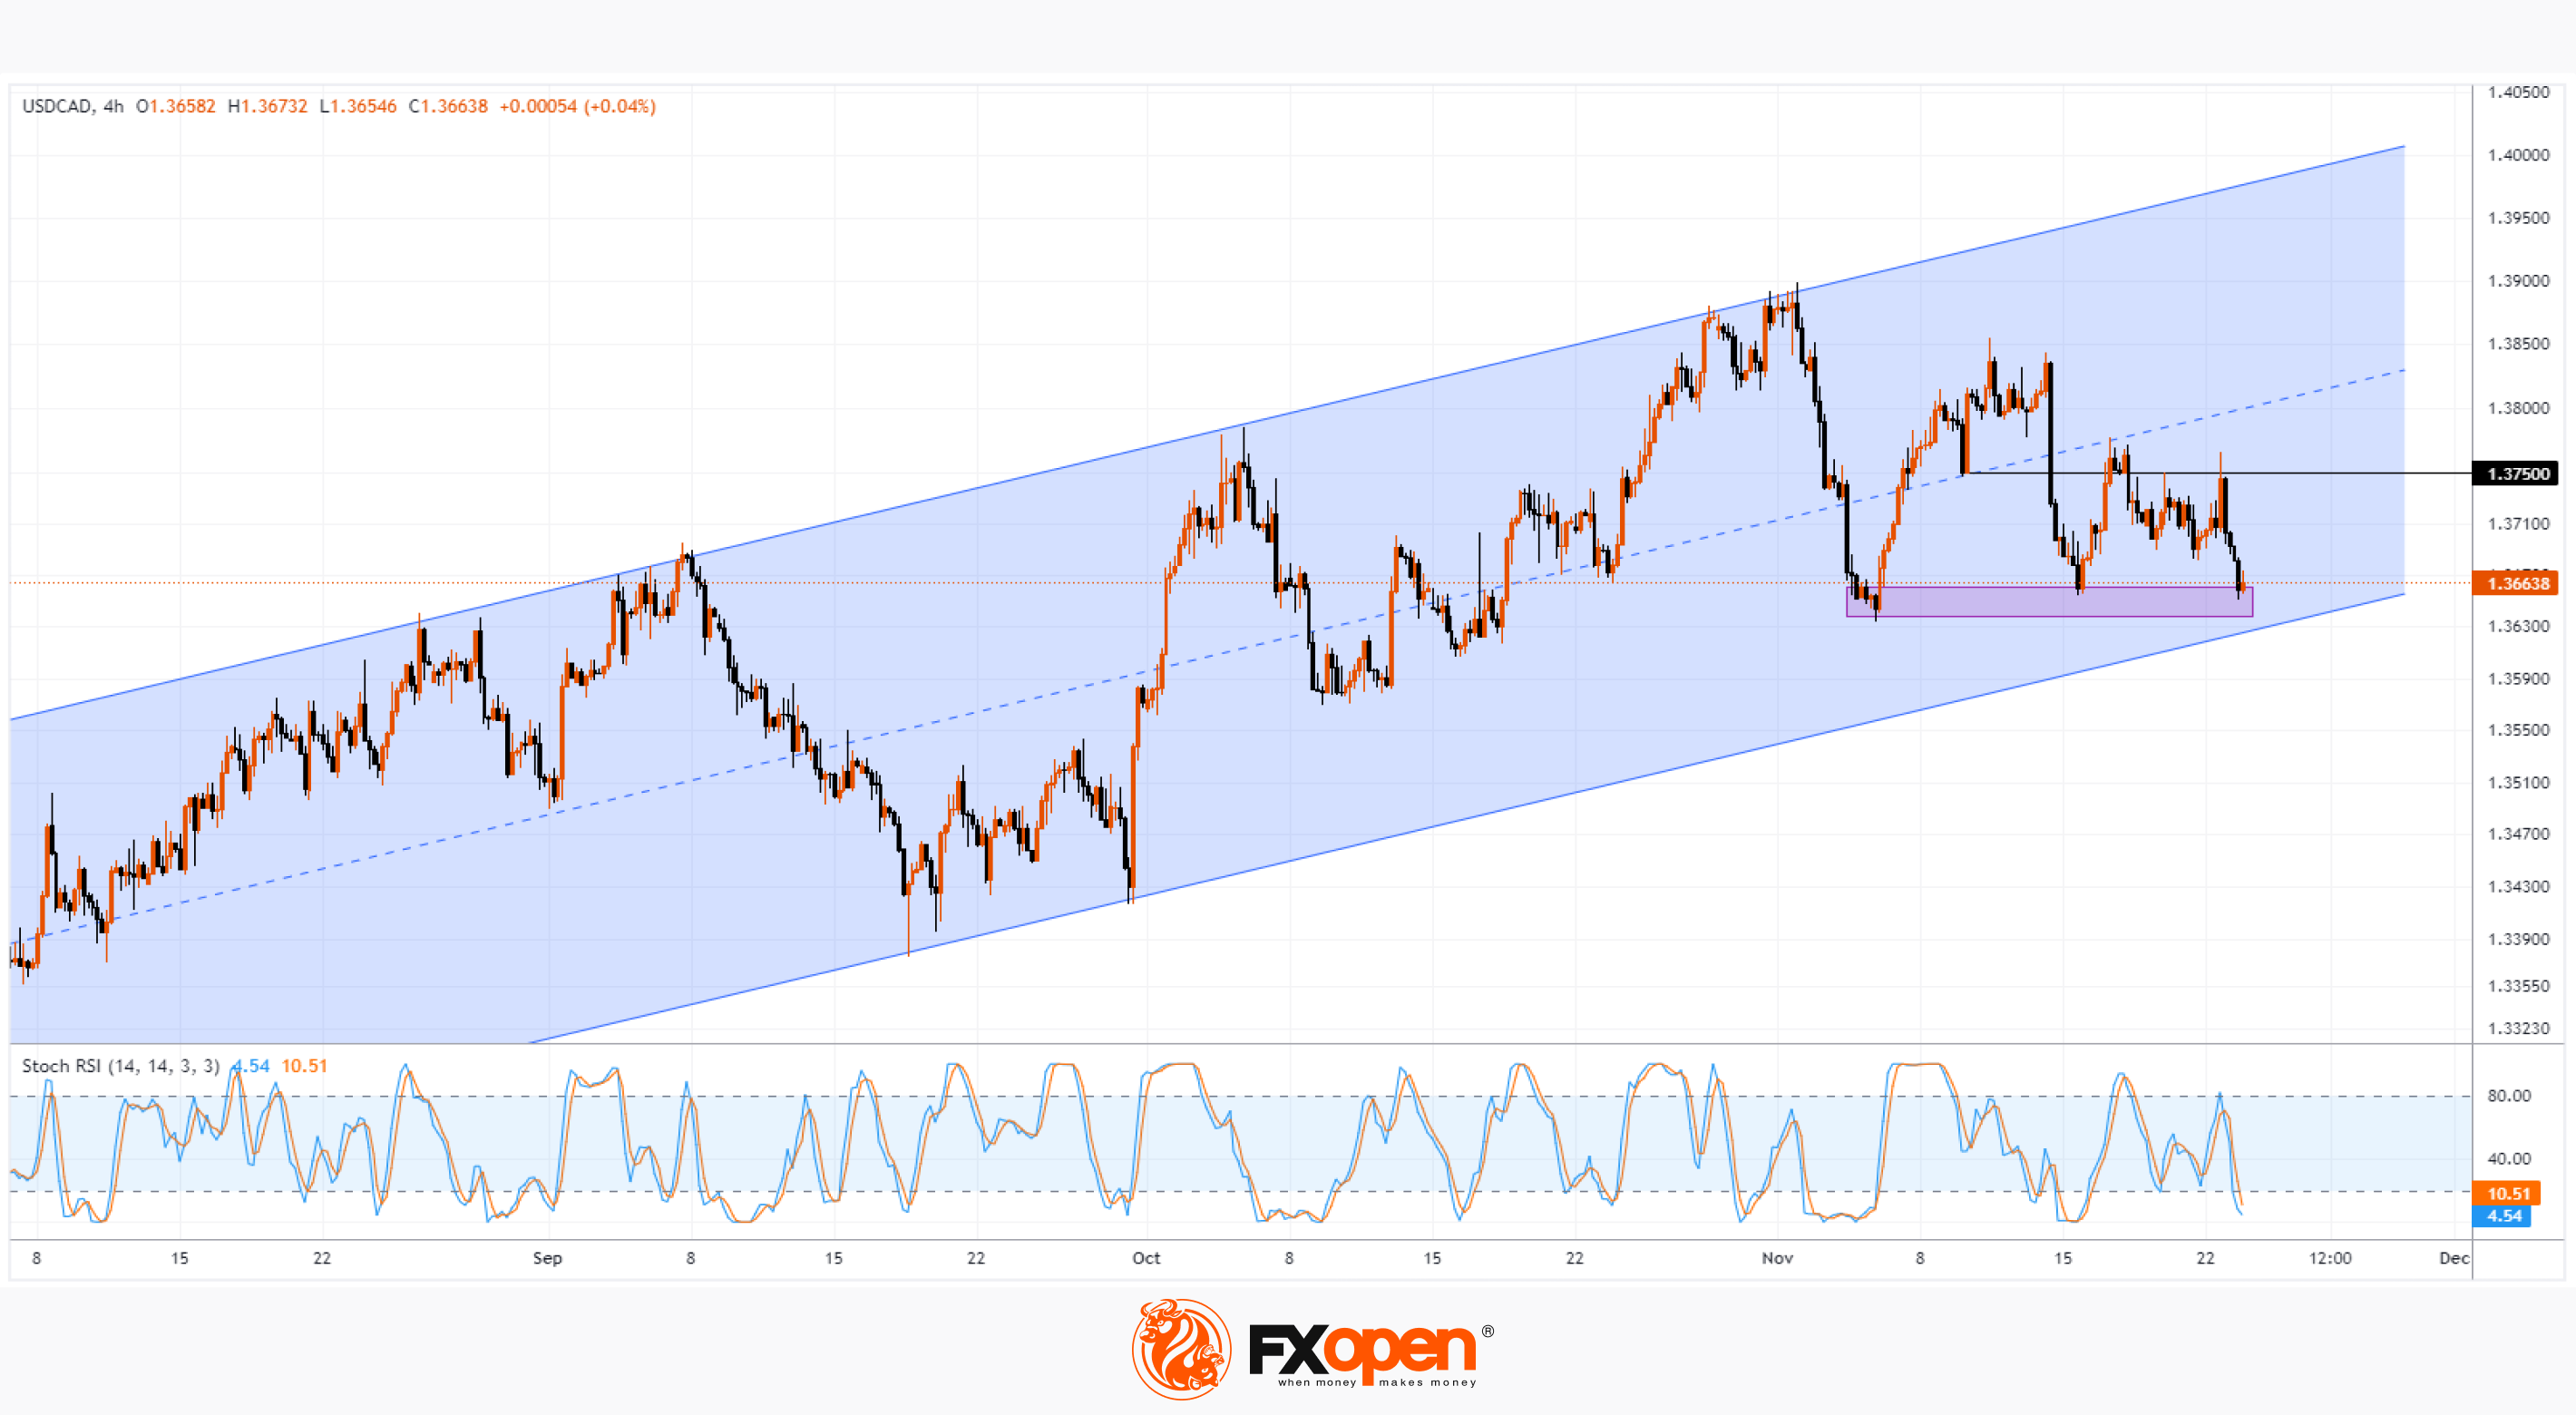
Meanwhile, the USD/CAD chart shows that the strengthening Canadian dollar has pushed the rate closer to an important support zone; it is formed by:
→ the lower line of the ascending channel (shown in blue), in which the rate has been since August;
→ as well as the support area (shown in purple) around the level of 1.364.
At the same time, the Stoch RSI indicator dropped into the oversold zone. From the point of view of technical analysis, the chart shows the prerequisites for the formation of a rebound. If it is strong enough, the price will be able to reach the resistance of 1.375.
Trade over 50 forex markets 24 hours a day with FXOpen. Take advantage of low commissions, deep liquidity, and spreads from 0.0 pips (additional fees may apply). Open your FXOpen account now or learn more about trading forex with FXOpen.
This article represents the opinion of the Companies operating under the FXOpen brand only. It is not to be construed as an offer, solicitation, or recommendation with respect to products and services provided by the Companies operating under the FXOpen brand, nor is it to be considered financial advice.
Stay ahead of the market!
Subscribe now to our mailing list and receive the latest market news and insights delivered directly to your inbox.


Latest articles

Nasdaq 100: Is This the Correction Traders Have Been Waiting For?
The Nasdaq 100 (US Tech 100 Mini on FXOpen) remains caught between two opposing forces: cooling inflation on one side, and persistent geopolitical instability on the other. On 14 July, June's CPI print came in softer than expected, easing near-term

XRP/USD: Symmetrical Triangle Forms as Trading Volume Fades
On 6 July, Ripple received a full Crypto-Asset Service Provider (CASP) licence under the Markets in Crypto-Assets (MiCA) regulation from Luxembourg's financial regulator, the CSSF. The approval allows the company to offer regulated crypto payment services across all 30 countries

AI Valuations Are Back in the Spotlight
Artificial intelligence remains the dominant investment theme of 2026, but investors are increasingly questioning whether AI stock valuations are keeping pace with reality.
💰 Big Tech continues to invest at an unprecedented scale, with hyperscaler AI spending projected to exceed $800