


FXOpen

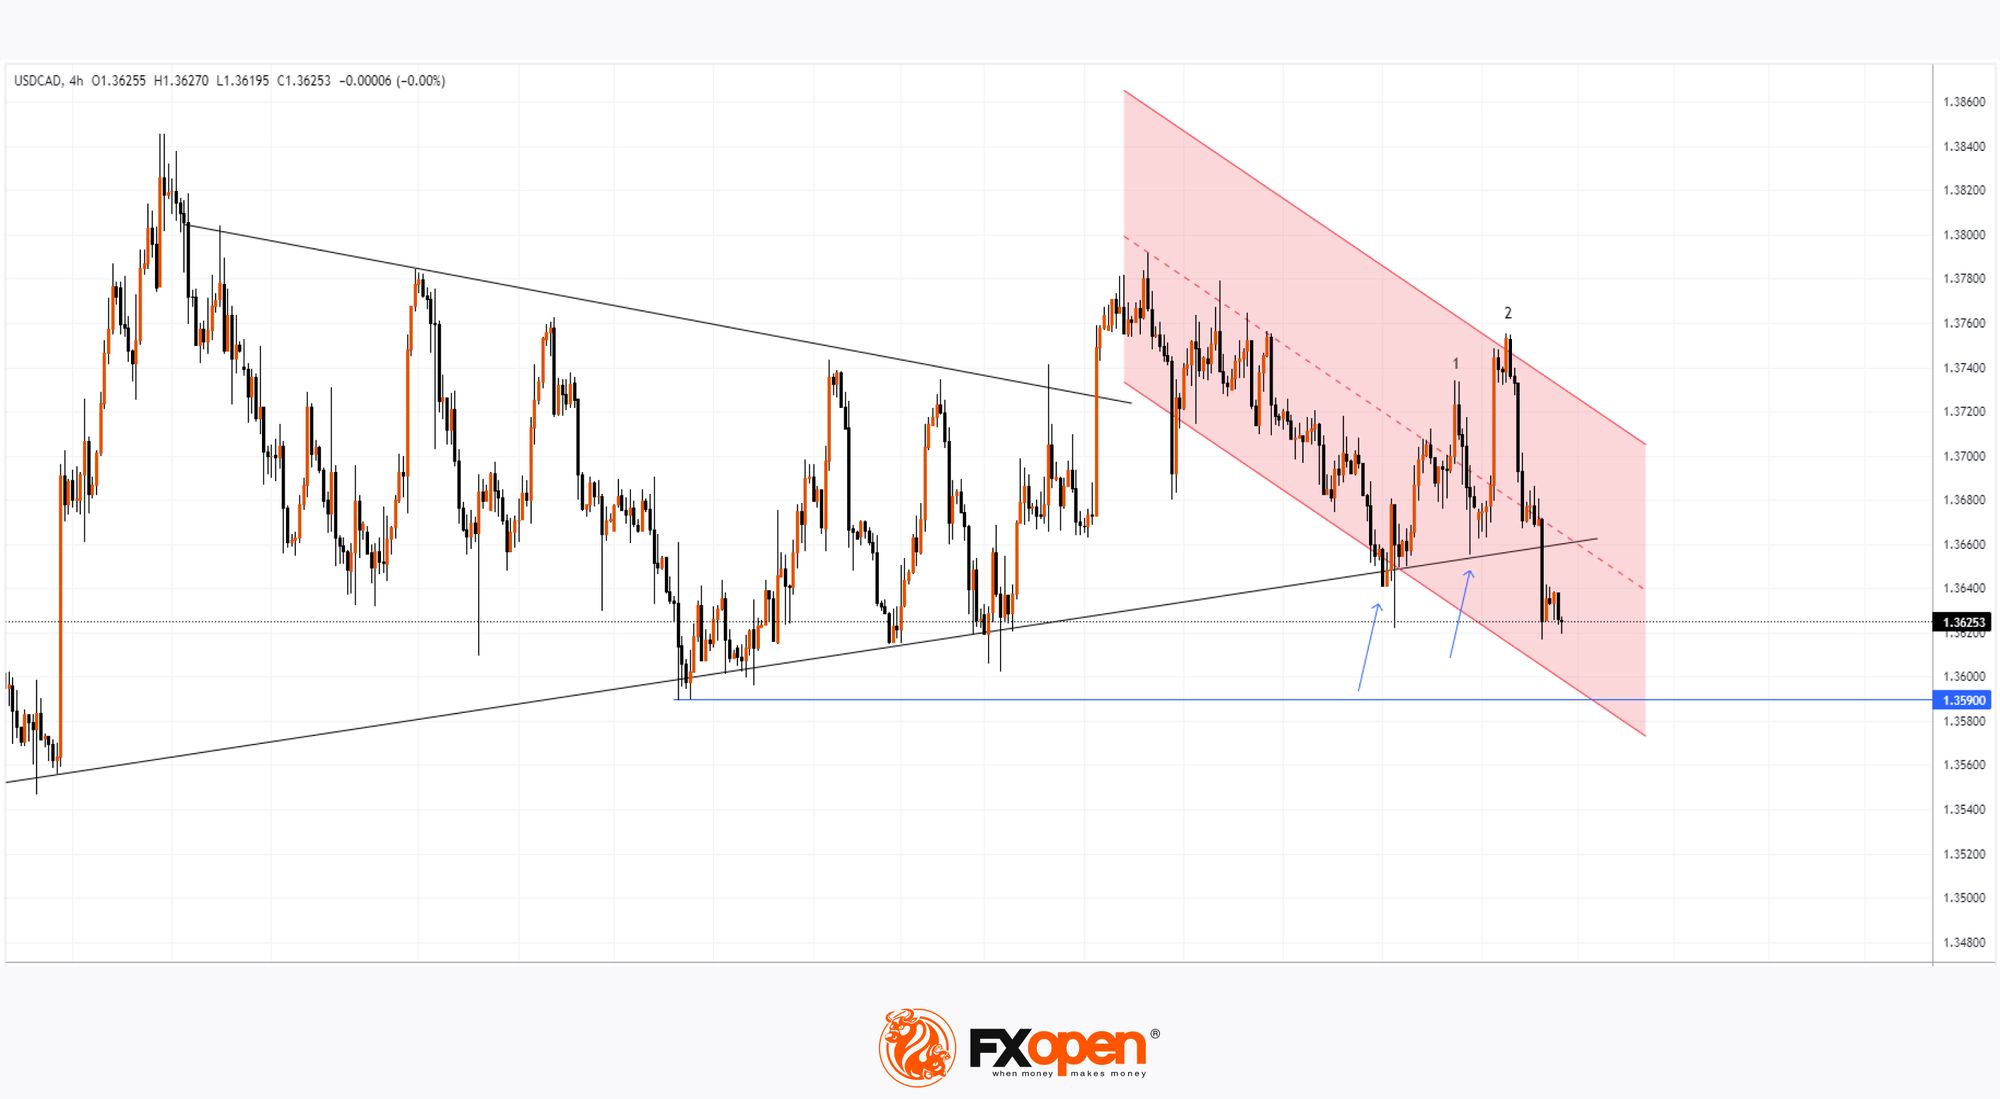
On 25 June, we noted that the USD/CAD price had approached a crucial support level—the lower boundary of a converging triangle, which indicated a relative balance of supply and demand in the market during May.
Since then, the price has bounced twice from this level (as indicated by the arrow).
Today, as the USD/CAD chart shows, the exchange rate is breaking through this key support, indicating a disruption in balance.
This has been influenced by the weakness of the USD. According to Reuters, the US dollar has declined relative to other currencies due to weaker-than-expected US economic data released on Wednesday. These included a weak ISM Services PMI report and the ADP Non-Farm Employment Change report, which might suggest an economic slowdown.
How might the Canadian dollar's exchange rate change relative to the US dollar?
According to today's technical analysis of the USD/CAD chart:
→ the price is moving within a descending trend channel (shown in red). The median line of the channel may serve as a resistance level;
→ the fact that bulls attempted to push the price upwards, breaking the peak at Point 1, but failed—a bearish signal;
→ the sharp rise to Peak 2 was followed by an even sharper fall—a sign of bearish engulfing.
Therefore, the dominance of supply forces could lead to a continuation of the downward movement. It is not out of the question for the USD/CAD exchange rate to decline to the lower boundary of the red channel, with an attempt to break the May low around 1.359.
However, sharp movements are unlikely today due to the celebration of Independence Day in the USA.
Read analytical USD/CAD price forecasts for 2024 and beyond.
Trade over 50 forex markets 24 hours a day with FXOpen. Take advantage of low commissions, deep liquidity, and spreads from 0.0 pips (additional fees may apply). Open your FXOpen account now or learn more about trading forex with FXOpen.
This article represents the opinion of the Companies operating under the FXOpen brand only. It is not to be construed as an offer, solicitation, or recommendation with respect to products and services provided by the Companies operating under the FXOpen brand, nor is it to be considered financial advice.
Stay ahead of the market!
Subscribe now to our mailing list and receive the latest market news and insights delivered directly to your inbox.


Latest articles

European Currencies Decline: Pound Hits New Lows, Euro Under Pressure
European currencies continue to weaken against the US dollar amid rising geopolitical tensions and increased demand for safe-haven and liquid assets. Market participants are reducing exposure to riskier instruments, putting pressure on both the euro and the pound. Additional support

Market Analysis: GBP/USD Dips Further As EUR/GBP Regains Traction
GBP/USD failed to climb above 1.3500 and corrected some gains. EUR/GBP started a decent increase and might aim for more gains above 0.8700.
Important Takeaways for GBP/USD and EUR/GBP Analysis Today
· The British Pound
