


FXOpen

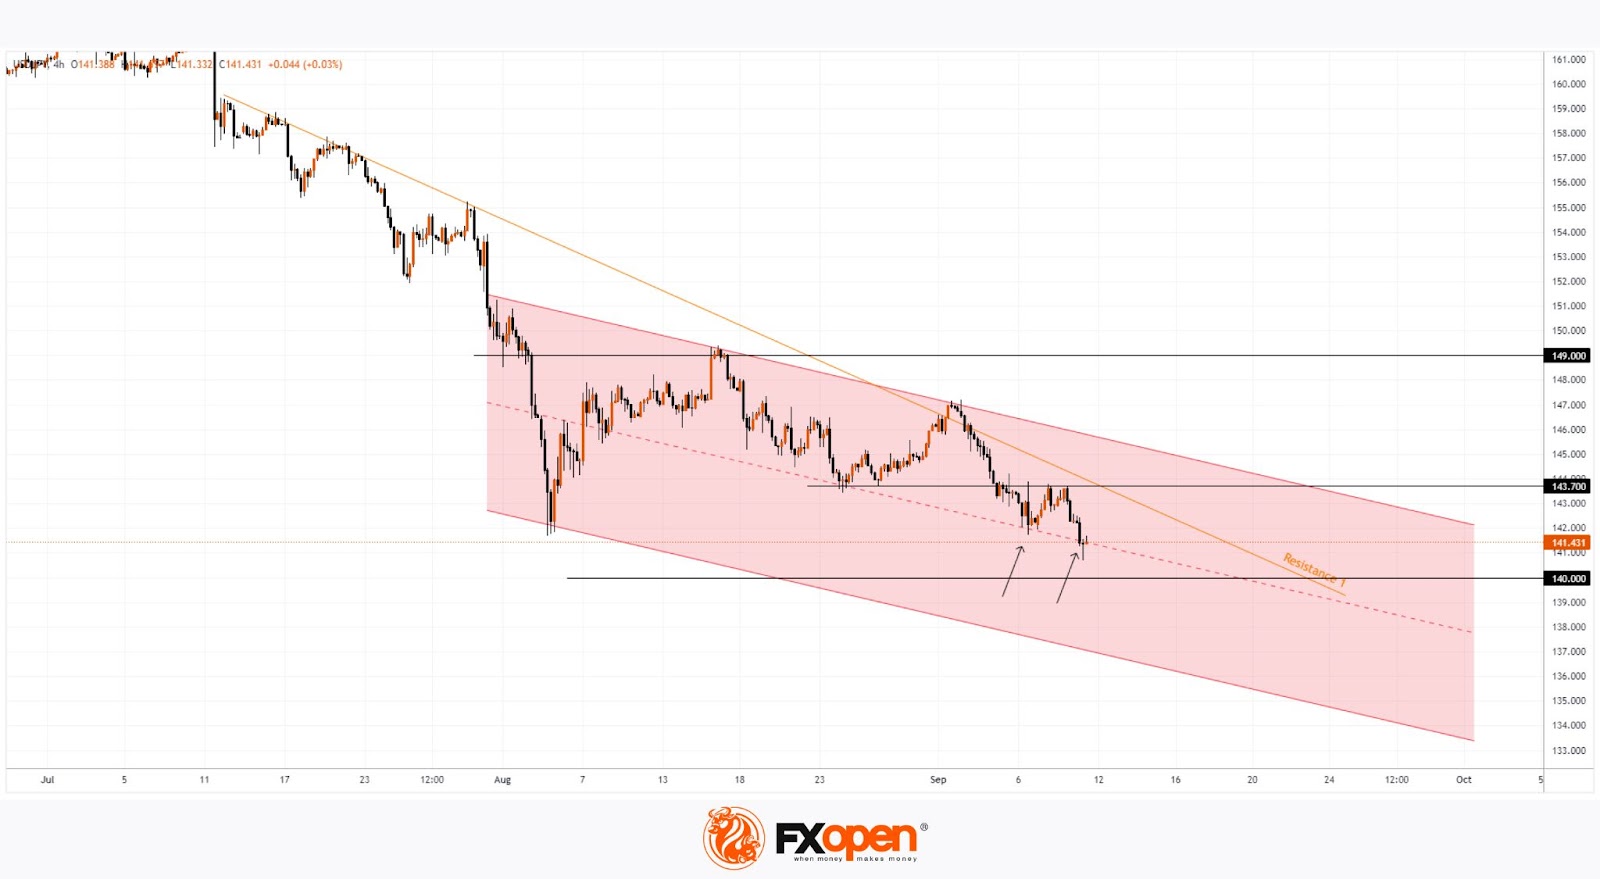
The USD/JPY chart shows the rate has fallen below its 5 August low.
This decline was influenced by comments from Bank of Japan representative Junko Nakagawa, who stated that the bank would continue raising interest rates if inflation keeps decreasing.
“Given that real interest rates are currently very low, we will adjust the level of monetary support to ensure the sustainable and stable achievement of our 2% inflation target,” she said.
Technical analysis of the USD/JPY chart shows:
→ Since early August, the price movement has fit within a descending channel (shown in red). → The price has fallen to the median of this channel, which continues to show signs of support (indicated by arrows).
Bearish dominance is evident as:
→ The 143.7 level has shifted from support to resistance, as previously happened with the 149 level.
→ The price is below the Resistance 1 trendline.
It’s worth noting that at 15:30 today, the US Consumer Price Index will be released, which is likely to cause increased market volatility.
As a result, bears may attempt to push the rate down to the psychological level of 140 yen per dollar as early as today.
Trade over 50 forex markets 24 hours a day with FXOpen. Take advantage of low commissions, deep liquidity, and spreads from 0.0 pips (additional fees may apply). Open your FXOpen account now or learn more about trading forex with FXOpen.
This article represents the opinion of the Companies operating under the FXOpen brand only. It is not to be construed as an offer, solicitation, or recommendation with respect to products and services provided by the Companies operating under the FXOpen brand, nor is it to be considered financial advice.
Stay ahead of the market!
Subscribe now to our mailing list and receive the latest market news and insights delivered directly to your inbox.


Latest articles

Weak Data Weigh on the Dollar: Market Awaits Trend Confirmation
The US dollar is retreating from recent highs, moving into a moderate correction after a prolonged period of gains. Pressure on the currency is building amid weaker-than-expected macroeconomic data, while market participants adopt a wait-and-see approach ahead of key labour

Market Analysis: EUR/USD Aims Recovery While USD/JPY Gives Back Recent Gains
EUR/USD is recovering losses from 1.1450. USD/JPY is correcting gains from 160.50 and might decline further below 158.00.
Important Takeaways for EUR/USD and USD/JPY Analysis Today
· The Euro struggled to stay in a

European Currencies Decline: Pound Hits New Lows, Euro Under Pressure
European currencies continue to weaken against the US dollar amid rising geopolitical tensions and increased demand for safe-haven and liquid assets. Market participants are reducing exposure to riskier instruments, putting pressure on both the euro and the pound. Additional support