


FXOpen

As shown in today’s USD/JPY chart, the US dollar has gained over 3.6% against the yen since the start of the month. Yesterday, the exchange rate surpassed the peak formed on 16 August around the 149.40 level, marking a 10-week high.
The bullish sentiment towards the US dollar has been influenced by increased market confidence in the Federal Reserve’s patient approach to further monetary easing, as reported by Reuters.
Can the USD/JPY rise continue?
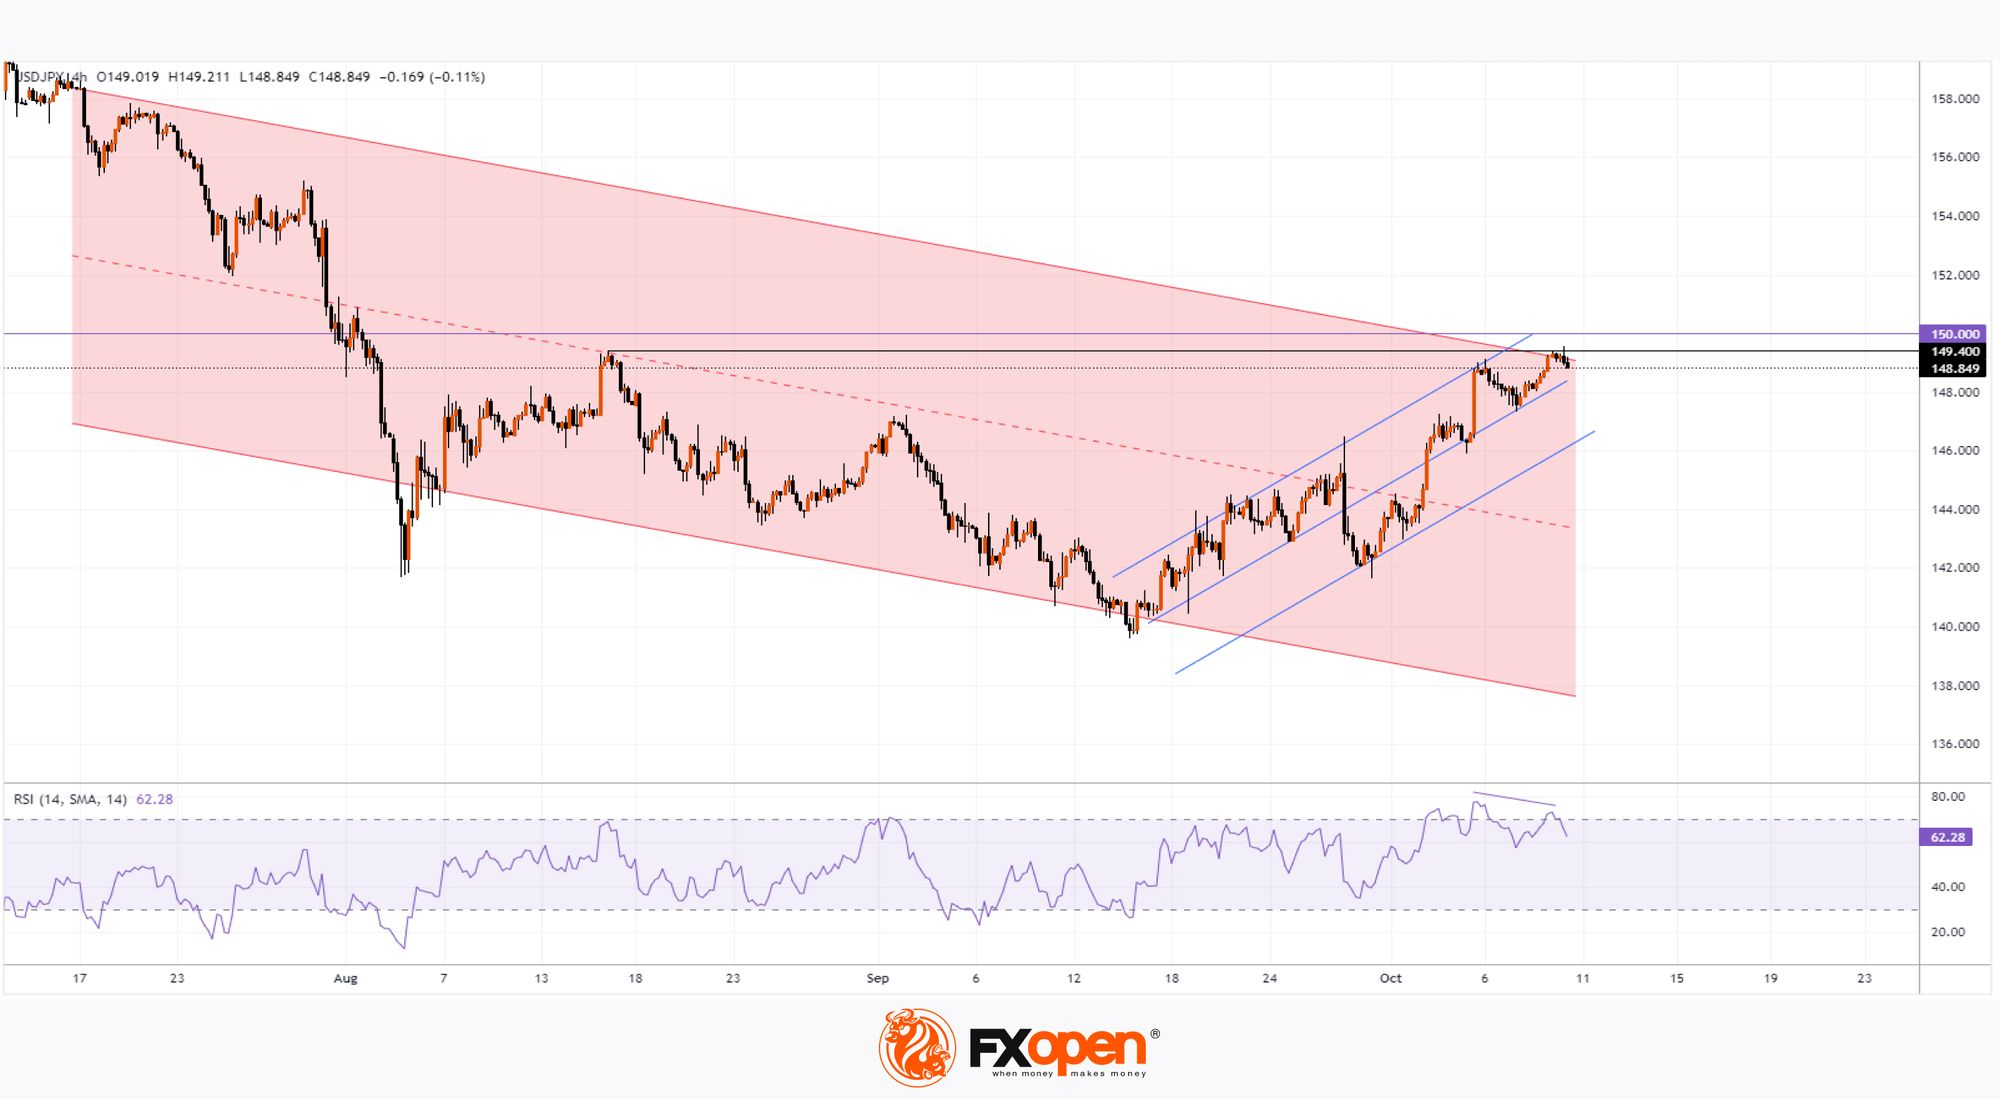
From a technical analysis perspective, bears have a chance to take control, as the rate is nearing a resistance zone formed by:
→ the upper boundary of the descending channel (shown in red);
→ the psychological level of 150 yen per dollar.
Additional arguments supporting the potential for a bearish reversal include:
→ the price decline after briefly exceeding the 16 August peak (a possible false bullish breakout);
→ divergence on the RSI indicator.
The release of the US CPI data today at 15:30 GMT+3 could serve as a catalyst for a bearish move. The resulting price action will provide traders with important insights on whether the market is nearing the end of an intermediate recovery (shown with blue lines) within the descending channel (shown in red).
Trade over 50 forex markets 24 hours a day with FXOpen. Take advantage of low commissions, deep liquidity, and spreads from 0.0 pips (additional fees may apply). Open your FXOpen account now or learn more about trading forex with FXOpen.
This article represents the opinion of the Companies operating under the FXOpen brand only. It is not to be construed as an offer, solicitation, or recommendation with respect to products and services provided by the Companies operating under the FXOpen brand, nor is it to be considered financial advice.
Stay ahead of the market!
Subscribe now to our mailing list and receive the latest market news and insights delivered directly to your inbox.


Latest articles

Market Analysis: GBP/USD Dips Further As EUR/GBP Regains Traction
GBP/USD failed to climb above 1.3500 and corrected some gains. EUR/GBP started a decent increase and might aim for more gains above 0.8700.
Important Takeaways for GBP/USD and EUR/GBP Analysis Today
· The British Pound


Market Insights with Gary Thomson: Oil, US Retail Sales & NFP in Focus
In this video, we’ll explore the key economic events and market trends, shaping the financial landscape. Get ready for insights into financial markets to help you navigate the week ahead. Let’s dive in!
In this episode of Market