


USD/JPY Exchange Rate Recovers from Yearly Low
FXOpen

As shown on the USD/JPY chart, today the exchange rate aggressively surged above the 153 yen per US dollar level. This marks a strong recovery from the yearly low of around 151 yen per dollar, set last week.
Today's bullish momentum developed following a statement from Japan's Minister of Industry, Yoji Muto, who mentioned that the government had asked the United States to exempt Japan from the tariffs imposed by the Trump administration.
Can the USD/JPY rise continue?
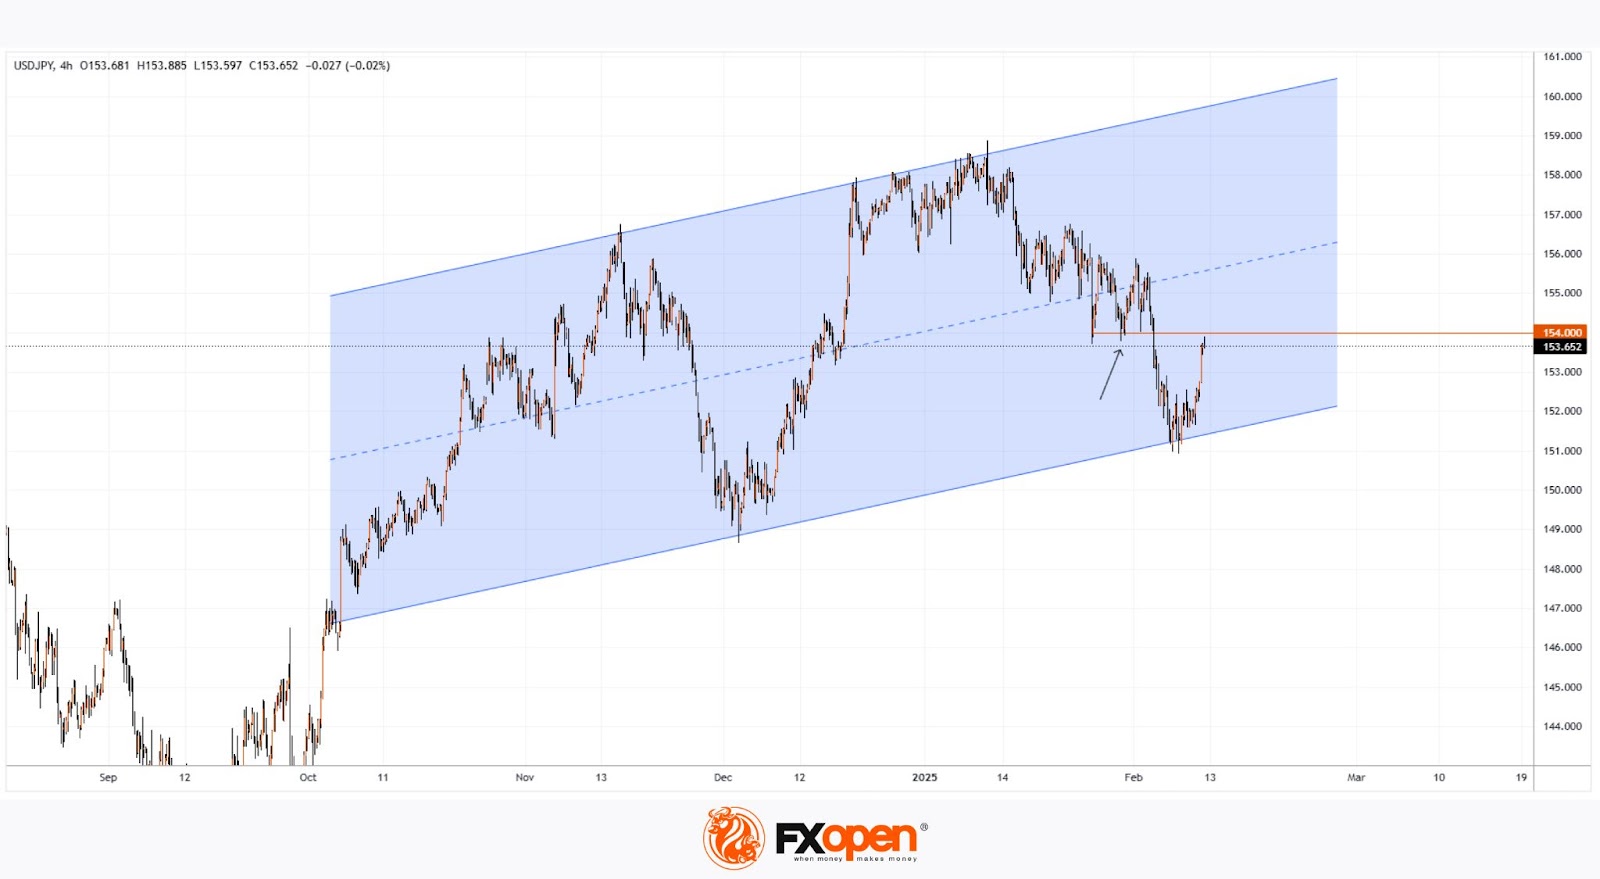
Technical analysis of the USD/JPY chart reveals that key extremes over the last three months form the contours of an upward channel, with:
→ From a bullish perspective: The exchange rate is rising towards the median, which tends to "attract" the price as demand and supply balance in this region.
→ From a bearish perspective: The 154 yen per dollar level, which acted as support in February (shown by arrows), may hinder further growth.
The future direction of the USD/JPY pair largely depends on a key upcoming news release, which could have a significant impact on the US dollar’s value against other currencies. At 16:30 GMT+3 today, the CPI report will be published, shedding light on the current inflation situation. Be prepared for potential volatility spikes.
Trade over 50 forex markets 24 hours a day with FXOpen. Take advantage of low commissions, deep liquidity, and spreads from 0.0 pips (additional fees may apply). Open your FXOpen account now or learn more about trading forex with FXOpen.
This article represents the opinion of the Companies operating under the FXOpen brand only. It is not to be construed as an offer, solicitation, or recommendation with respect to products and services provided by the Companies operating under the FXOpen brand, nor is it to be considered financial advice.
Stay ahead of the market!
Subscribe now to our mailing list and receive the latest market news and insights delivered directly to your inbox.


Latest articles


Market Repricing of Risk as Gold Loses Safe-Haven Demand
Geopolitical tensions in the Middle East had remained the primary macro driver for the gold market over recent weeks; however, on 8 April the situation shifted sharply as the United States and Iran agreed to a temporary two-week ceasefire, including

Commodity Currencies on the Rise: Market Focus Shifts to US and Canadian Data
Commodity-linked currencies continue to strengthen, while the US dollar remains under pressure amid easing geopolitical tensions and a shift in investor preference towards riskier assets. Reports of a temporary ceasefire between the US and Iran have helped stabilise sentiment and