


FXOpen

On Friday, the price of a barrel of WTI crude oil exceeded USD 80 per barrel due to the decision to continue the policy of reducing oil production by OPEC+ countries.
Saudi Arabia said on Sunday it would extend oil production cuts until June to “maintain stability and balance in oil markets,” an official statement said. Kuwait and the United Arab Emirates also said they would also continue cuts.
NYT writes that the decision was expected. At the same time, the price of WTI oil exceeded USD 80 per barrel on Friday for the first time since the beginning of November 2023.
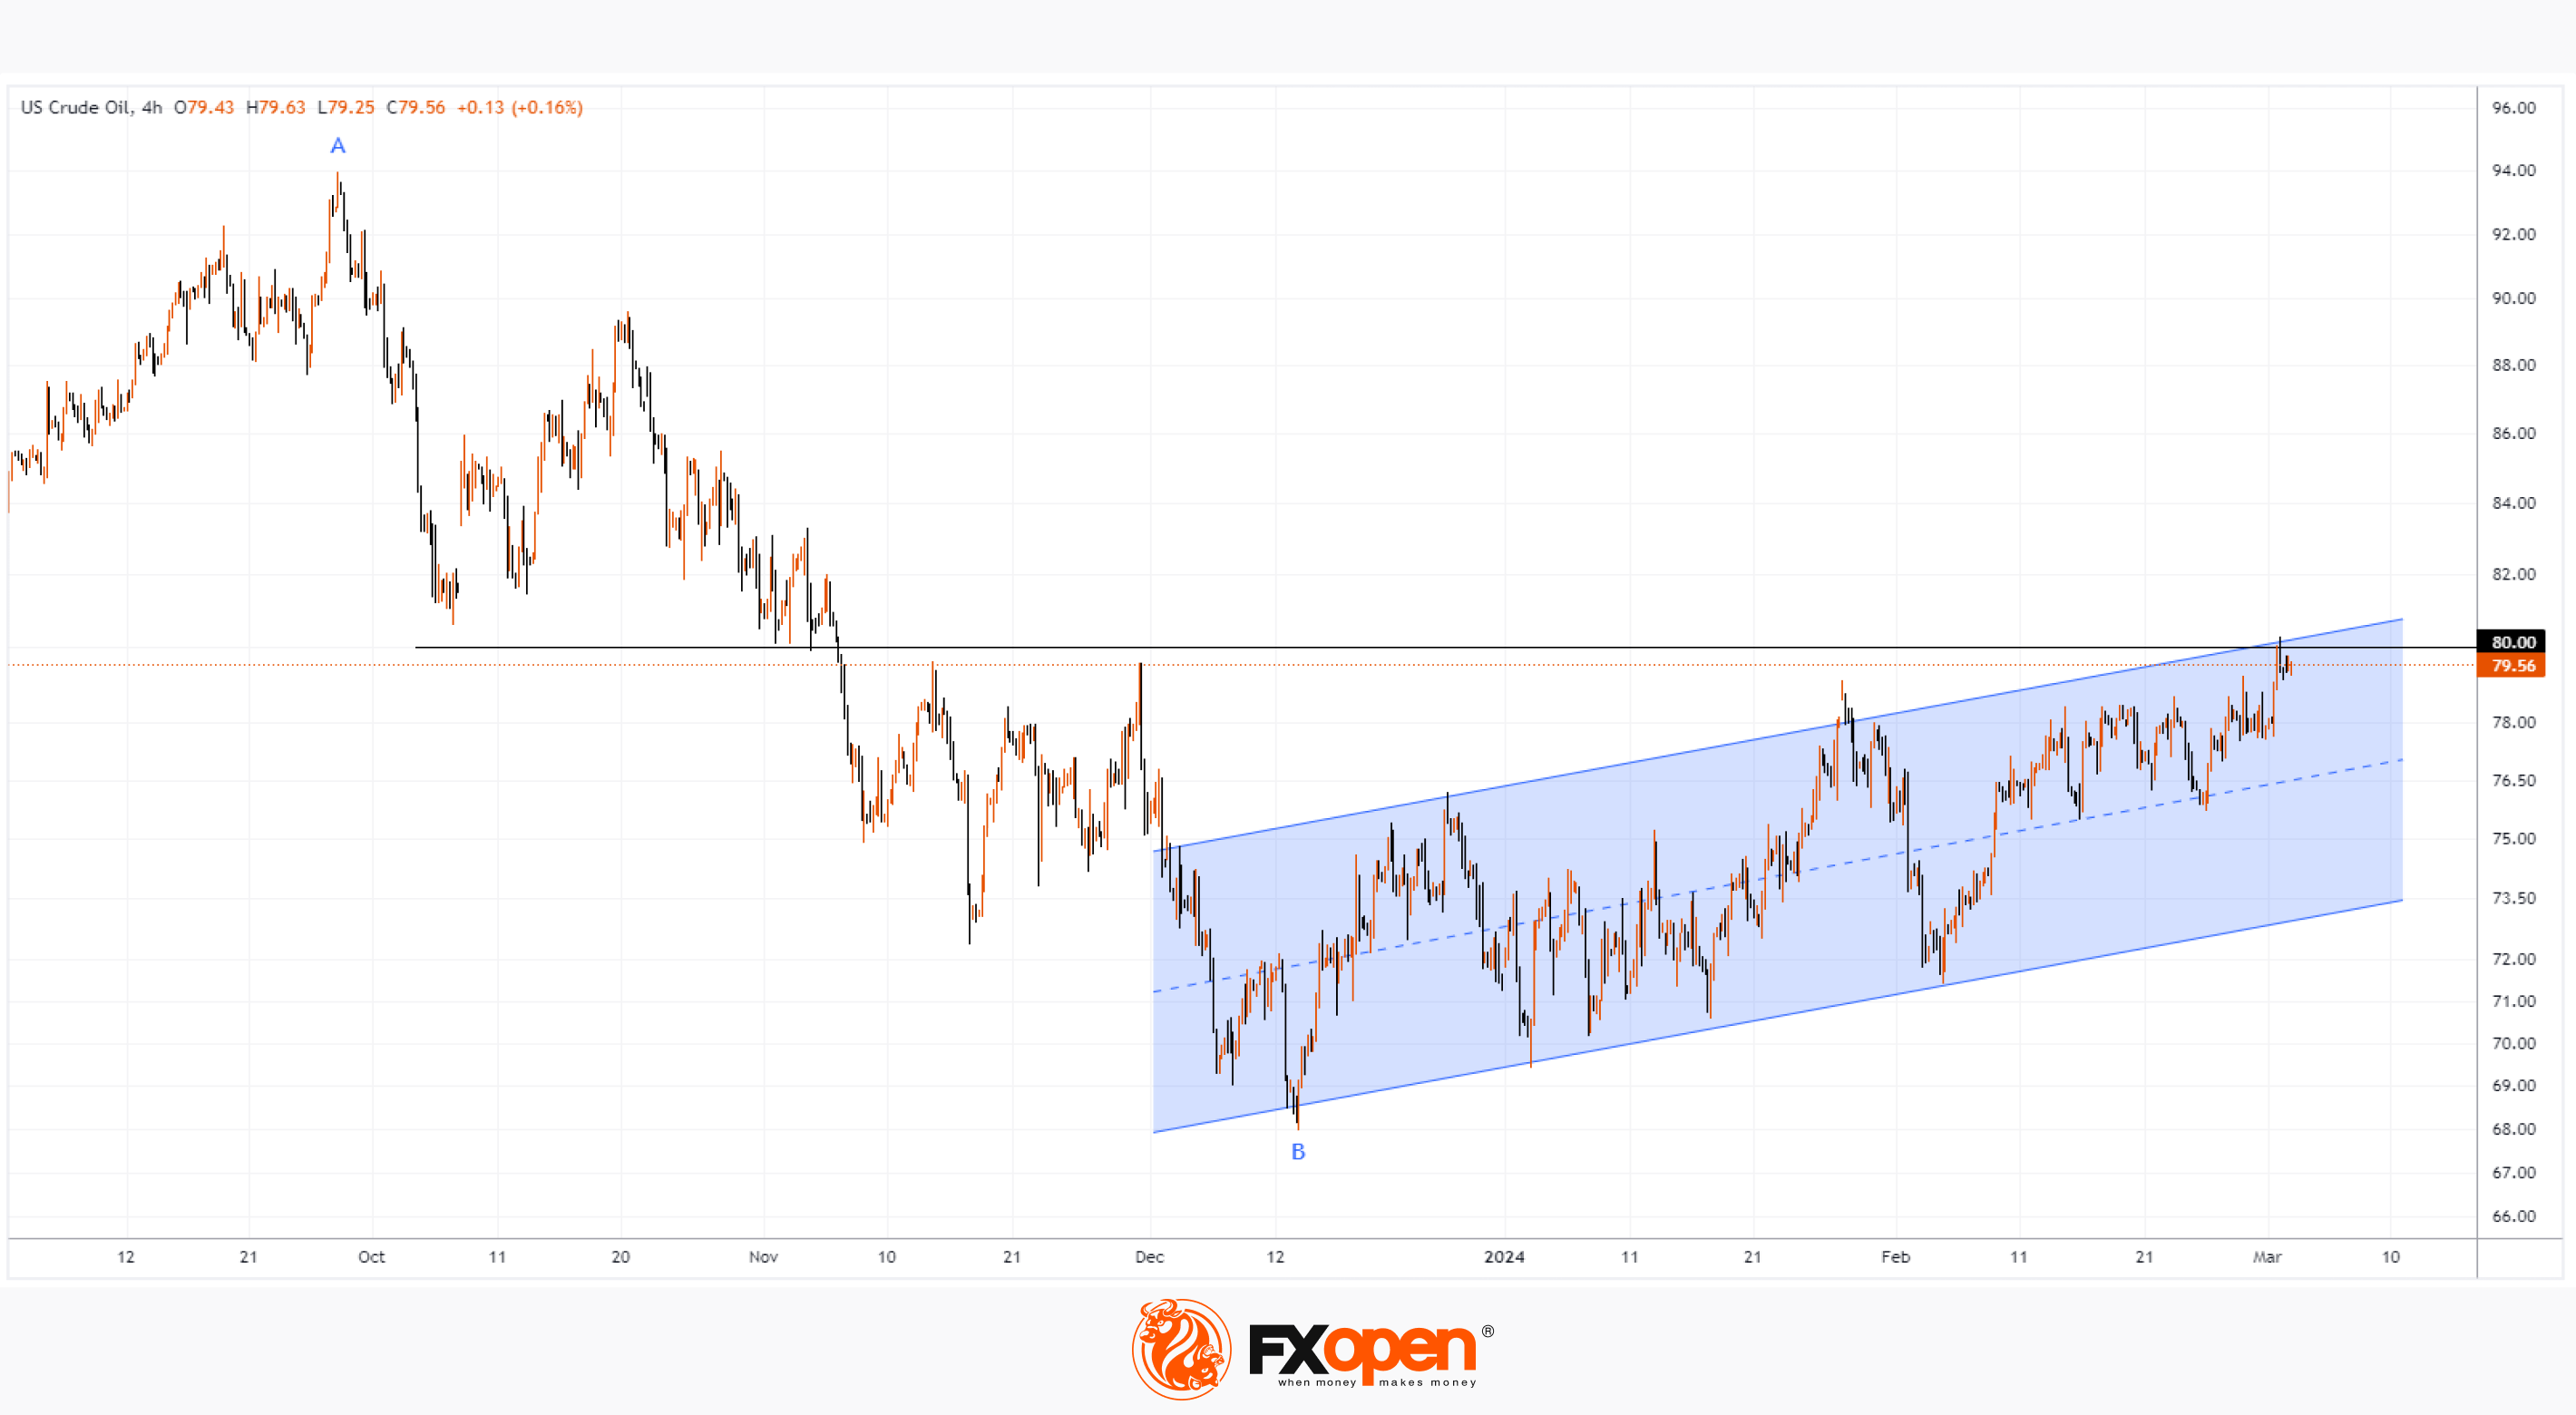
The price chart for WTI oil shows that the market has been in an upward trend since mid-December - the price has formed an upward channel (shown in blue). In addition to the OPEC+ policy, the strength of demand is also supported by:
→ uncertainty in the military conflict between Hamas and Israel;
→ facts of attacks on oil tankers in the Red Sea.
Will the price be able to consolidate at the peak reached? Arguments against the development of such a scenario are provided by a technical analysis of the WTI oil price chart:
→ the price is at the upper border of the ascending blue channel (that is, near the resistance line);
→ the USD 80 level can act as psychological resistance with the formation of a false breakout pattern;
→ the top formed on Friday is in the resistance area of the Fibonacci level of 50% of the decline A→B.
Thus, there are prerequisites to assume that the market is in a vulnerable position for a pullback after the effect of the news about the OPEC+ decision is fully taken into account. It is possible that the price of WTI oil may roll back to the support of the median line of the ascending blue channel.
Start trading commodity CFDs with tight spreads (additional fees may apply). Open your trading account now or learn more about trading commodity CFDs with FXOpen.
This article represents the opinion of the Companies operating under the FXOpen brand only. It is not to be construed as an offer, solicitation, or recommendation with respect to products and services provided by the Companies operating under the FXOpen brand, nor is it to be considered financial advice.
Stay ahead of the market!
Subscribe now to our mailing list and receive the latest market news and insights delivered directly to your inbox.


Latest articles

Market Analysis: GBP/USD Dips Further As EUR/GBP Regains Traction
GBP/USD failed to climb above 1.3500 and corrected some gains. EUR/GBP started a decent increase and might aim for more gains above 0.8700.
Important Takeaways for GBP/USD and EUR/GBP Analysis Today
· The British Pound


Market Insights with Gary Thomson: Oil, US Retail Sales & NFP in Focus
In this video, we’ll explore the key economic events and market trends, shaping the financial landscape. Get ready for insights into financial markets to help you navigate the week ahead. Let’s dive in!
In this episode of Market