


FXOpen

Another shocking Monday for the energy market. Last week’s start was remembered for a bullish gap of more than 10% (which was later followed by a pullback), but today’s market open proved even more volatile (as reflected by the ATR indicator). After a bullish gap of roughly 11%, the price continued to climb, reaching a peak of around $114 per barrel of WTI during the Asian session. This is the highest price since 2022.
The drivers of the rally are obvious – the escalation of the war in the Middle East, with more countries becoming involved. Risks have reached a critical point, with discussions emerging around the scenario of a complete blockade of shipping through the Strait of Hormuz. In such a case, oil-producing countries could invoke force majeure as grounds for halting supplies.
Technical Analysis of the XTI/USD Chart
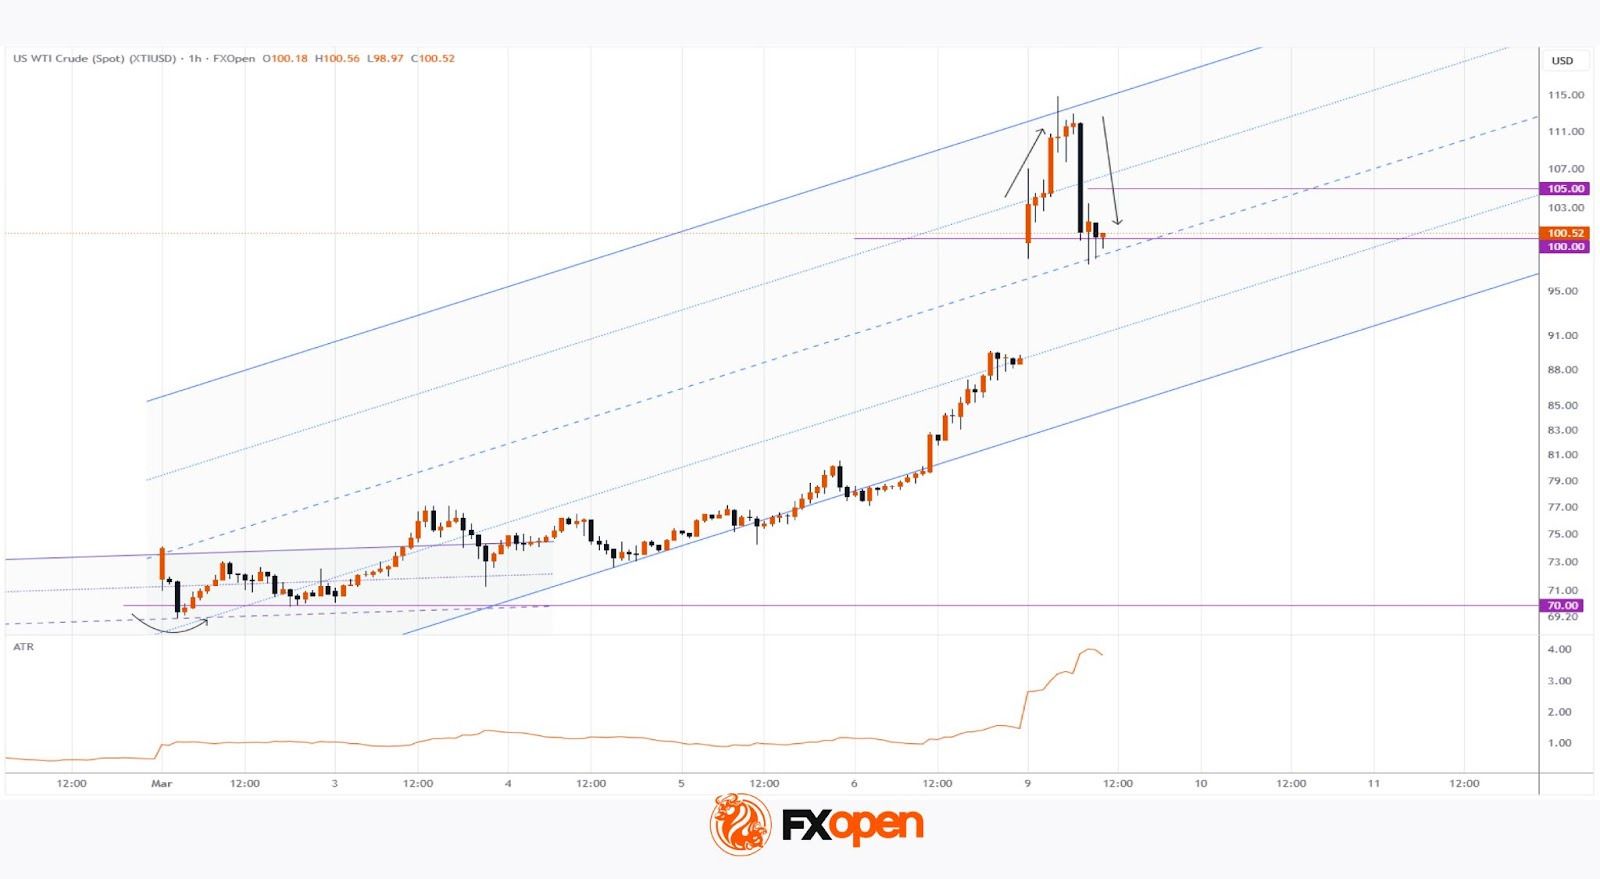
Analysing the oil price chart a week ago, we assumed that the $70 level would act as support. Indeed, the market remained above this psychological level, while rising highs and lows reflected traders’ concerns.
Extreme volatility must be taken into account when applying classical technical patterns. Today, the oil price chart allows us to draw a broad ascending channel with a steep slope. In this context, it is worth noting (as indicated by the arrows):
→ the rapid rise in oil prices within the upper quarter of the channel;
→ the subsequent reversal and a swift decline towards the median.
This price action (essentially resembling a Bearish Engulfing pattern) points to a sharp shift in sentiment.
From the bulls’ perspective → the median of the wide channel, reinforced by the psychological $100 level, may act as support.
However, judging by the extremely wide candle, during which the XTI/USD quote dropped from $111 to $100 today, it is reasonable to assume that the initiative currently lies with the bears. And even if a rebound from the median occurs, it may fade near the $105 level (which has already acted as resistance on lower timeframes).
Start trading commodity CFDs with tight spreads (additional fees may apply). Open your trading account now or learn more about trading commodity CFDs with FXOpen.
This article represents the opinion of the Companies operating under the FXOpen brand only. It is not to be construed as an offer, solicitation, or recommendation with respect to products and services provided by the Companies operating under the FXOpen brand, nor is it to be considered financial advice.
Stay ahead of the market!
Subscribe now to our mailing list and receive the latest market news and insights delivered directly to your inbox.


Latest articles

Consolidation Ahead of NFP: Commodity Currencies Search for Direction
Commodity-linked currencies have entered a consolidation phase following recent directional moves, as market participants adopt a wait-and-see approach ahead of key US labour market data. Current price action reflects a balance between ongoing demand for the US dollar and attempts

The Real Driver Behind the Dollar Rally: Market Insights with Gary Thomson
The US dollar has been firm, but the drivers behind the move may be more complex than they first appear.
While geopolitical tension and shifts in risk sentiment play a role, current price behaviour seems increasingly influenced by inflation expectations

EUR/USD and USD/CHF Pull Back: Market Reacts to Fundamentals
European currencies have shown a recovery in recent trading sessions after their recent decline, displaying early signs of a reversal. The US dollar is weakening amid expectations surrounding upcoming US macroeconomic data, while market participants are reassessing their short-term positions