


XAG/USD Analysis: Silver Price Approaching $35
FXOpen

Precious metal prices are fluctuating near multi-year highs due to safe-haven demand driven by:
→ Uncertainty surrounding the U.S. elections,
→ Ongoing tensions in the Middle East,
→ Expectations of central banks lowering interest rates.
As seen on the XAG/USD chart, silver prices:
→ Are near their highest levels in 12 years,
→ Are approaching the $35 mark,
→ Have risen by over 43% since the start of the year.
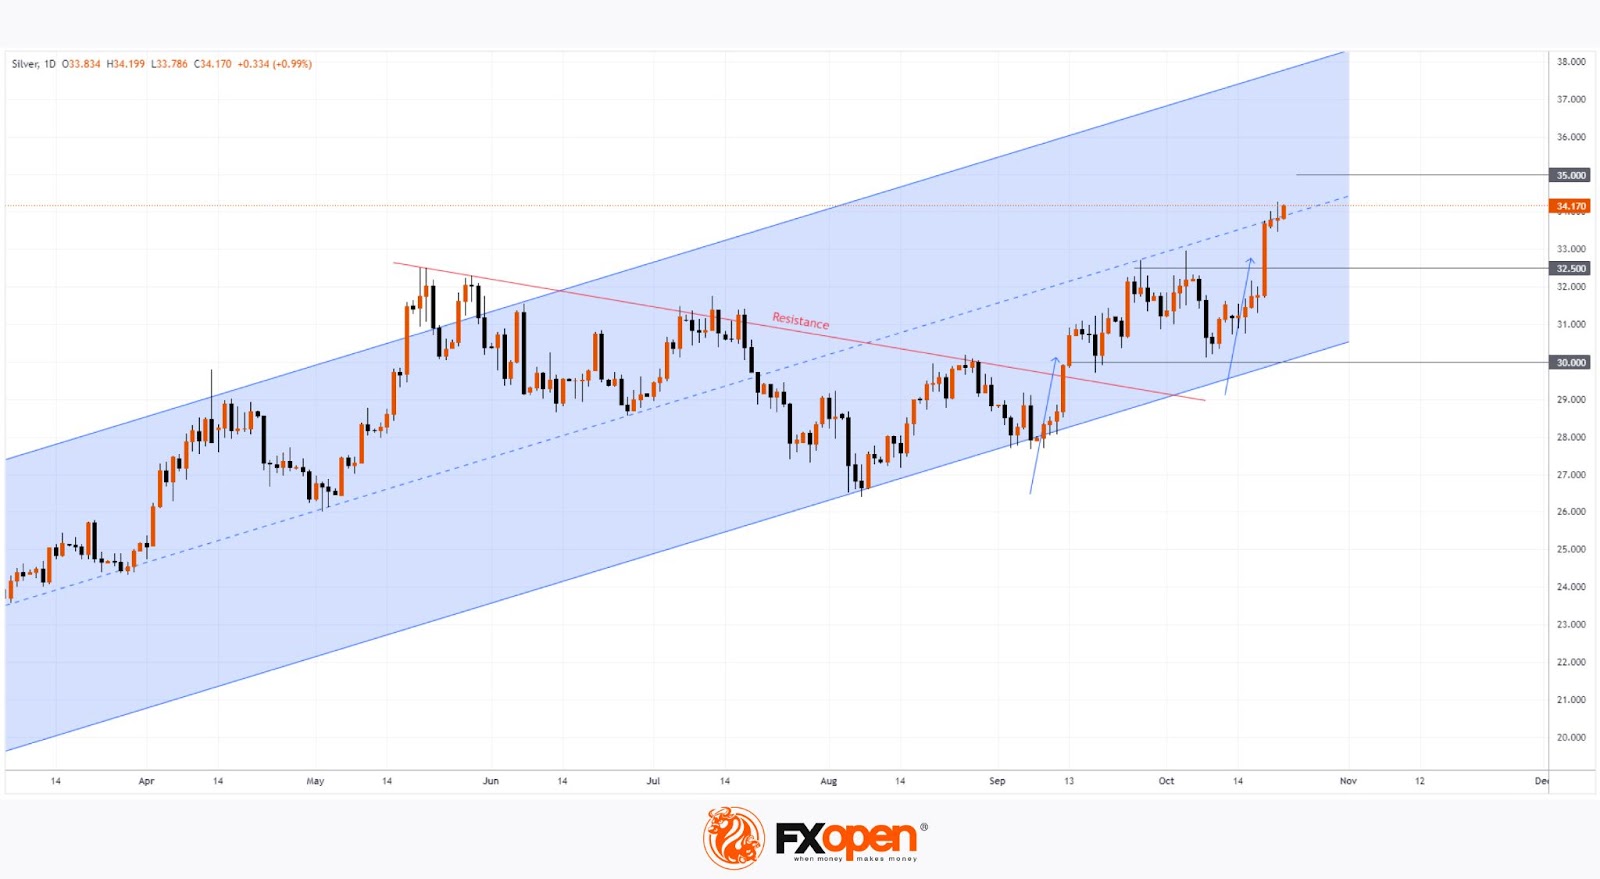
Technical analysis of the XAG/USD chart indicates that silver is following an upward trend (shown in a blue channel), with the current price near its median line. This suggests a potential balance between supply and demand, which could stabilise price fluctuations.
Key observations:
→ A red resistance line on the chart reflects a corrective phase within the blue channel.
→ Breaking through this resistance in September triggered a strong bullish impulse (marked by a blue arrow).
→ This impulse was so robust that it pushed the price above the psychological $30 level, turning it into support.
A similar pattern might emerge in the future. After another strong bullish move (marked by a second blue arrow), the $32.5 level could also become a support area.
Read analytical Silver price forecasts for 2024 and beyond.
Start trading commodity CFDs with tight spreads (additional fees may apply). Open your trading account now or learn more about trading commodity CFDs with FXOpen.
This article represents the opinion of the Companies operating under the FXOpen brand only. It is not to be construed as an offer, solicitation, or recommendation with respect to products and services provided by the Companies operating under the FXOpen brand, nor is it to be considered financial advice.
Stay ahead of the market!
Subscribe now to our mailing list and receive the latest market news and insights delivered directly to your inbox.


Latest articles

AUD/CAD: Months of Indecision — Is a Breakout Finally Coming?
The Australian dollar has clawed back most of its end-of-June losses, when it touched three-month lows against the greenback amid escalating Middle East tensions. Since then, sentiment has improved: the RBA's Assistant Governor Sarah Hunter signalled the board stands ready

USD/JPY: Battling at the Top of the Triangle
On 3 July, Japan's Finance Minister, Satsuki Katayama, stated that the Ministry of Finance remains in close contact with US authorities regarding developments in USD/JPY as the yen traded near its weakest level in almost 40 years. Similar verbal

Dow Jones (DJIA): Consolidation Beyond the Trend
Federal Reserve Chair Kevin Warsh testified before Congress on 14–15 July, reaffirming the Fed's commitment to bringing inflation back to target while providing no clear guidance on the future path of interest rates. Meanwhile, June inflation data came in