


XAG/USD Analysis: Silver Price Balances at Key Support
FXOpen

As reflected in the XAG/USD chart, the price of silver this morning is trading near $30.2, just above a critical support zone formed by:
→ The psychological level of $30.00;
→ The lower boundary of the ascending channel. As indicated by the blue arrows, this lower boundary has consistently provided support, enabling bullish reversals in silver prices throughout 2024.
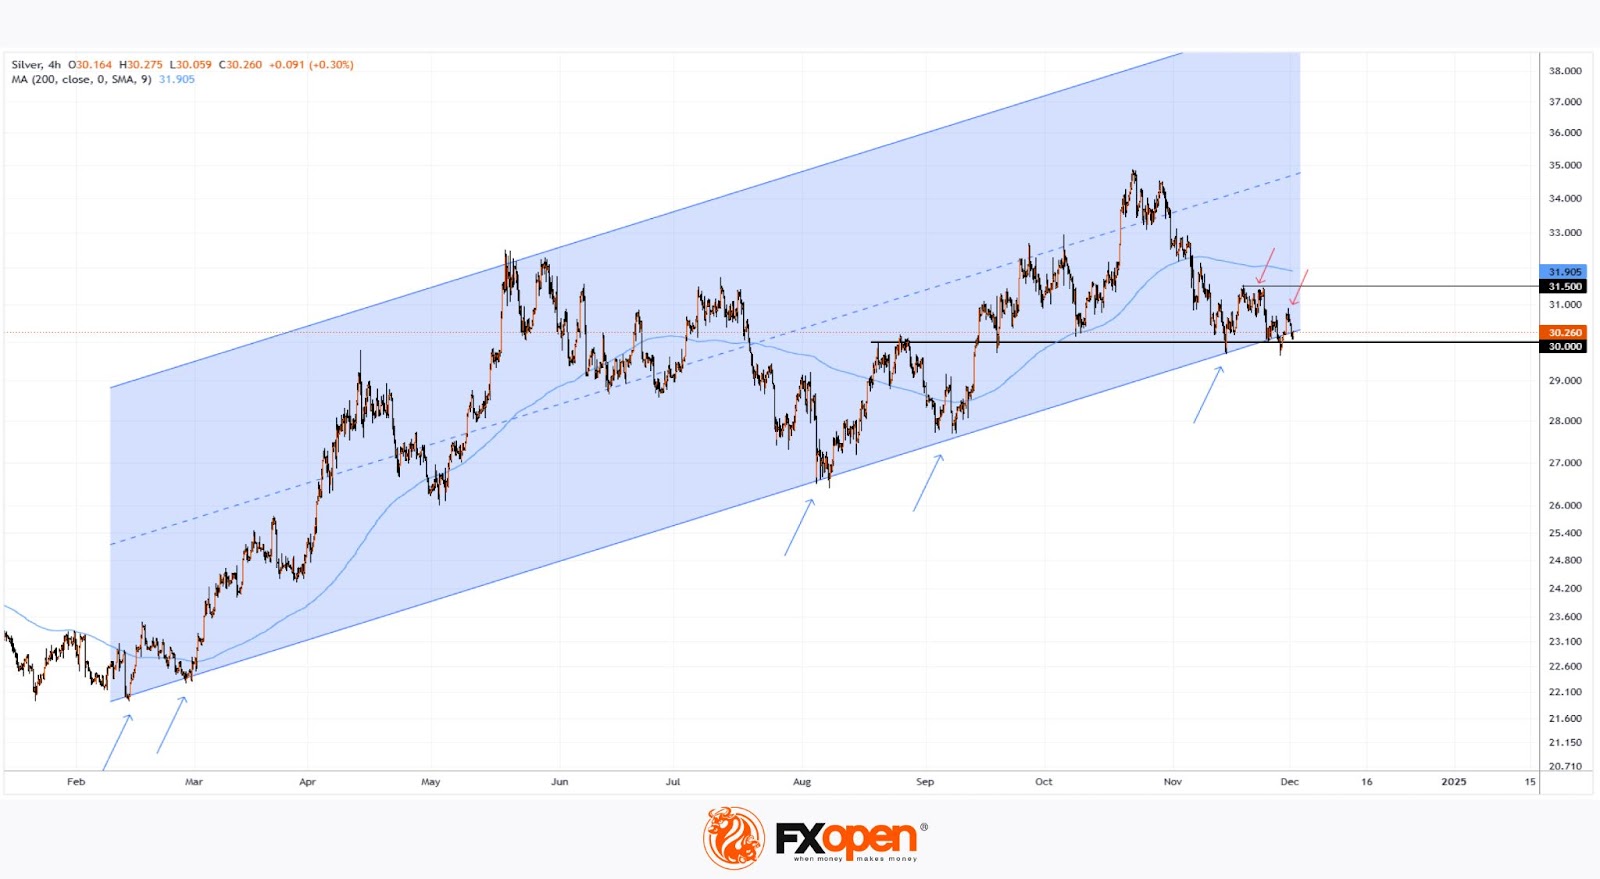
However, the price is currently below the 200-day moving average (MA), which is trending downward. An examination of price action in November reveals a lack of sustained growth following two breaches of the psychological level. As the red arrows illustrate:
→ On the first occasion, the price encountered resistance near $31.50;
→ On the second, it failed to rise above $31.
This could indicate weak demand, increasing the risk of a bearish breakout below the key support zone, potentially breaking the 2024 uptrend.
Meanwhile, analysts remain optimistic, citing strong fundamentals. According to media reports:
→ ANZ Research analysts forecast silver prices reaching $35.4 in 2025;
→ JP Morgan analysts predict silver at $36;
→ Saxo Bank analysts anticipate prices climbing to $40 by 2025.
Start trading commodity CFDs with tight spreads (additional fees may apply). Open your trading account now or learn more about trading commodity CFDs with FXOpen.
This article represents the opinion of the Companies operating under the FXOpen brand only. It is not to be construed as an offer, solicitation, or recommendation with respect to products and services provided by the Companies operating under the FXOpen brand, nor is it to be considered financial advice.
Stay ahead of the market!
Subscribe now to our mailing list and receive the latest market news and insights delivered directly to your inbox.


Latest articles

European Currencies Seek Stability Amid Rising Geopolitical Tensions
European currencies are showing mixed performance as they attempt to stabilise following their recent decline and the release of the Federal Reserve's latest meeting minutes. The minutes revealed growing concern over persistent inflationary pressures, with several policymakers supporting the possibility

Netflix: Attempting to Break the Short-Term Downtrend
Netflix is preparing to release its financial results for the second quarter of 2026. According to the company's official press release published on 15 June, the earnings report will be released on 16 July, followed by a video interview with
DAX 40: Can the Index Print Fresh Record Highs Once Again?
The DAX 40 has shed more than 2% over the past several sessions, breaking a rally that had pushed the index to record highs on the back of Germany's fiscal pivot toward defence, infrastructure and climate spending. The pullback raises