


FXOpen

As shown on the XBR/USD chart, Brent crude oil prices surged by over 8.5% last week — marking the largest increase in 2024, driven by escalating tensions in the Middle East.
Although oil prices continued to climb earlier this week, a pullback occurred on Tuesday, causing Brent crude to drop below the $80 level. It appears that market participants expect U.S. authorities to prevent the conflict from worsening ahead of the presidential elections, prompting them to lock in profits from previous long positions based on the technical outlook.
XBR/USD Technical Analysis
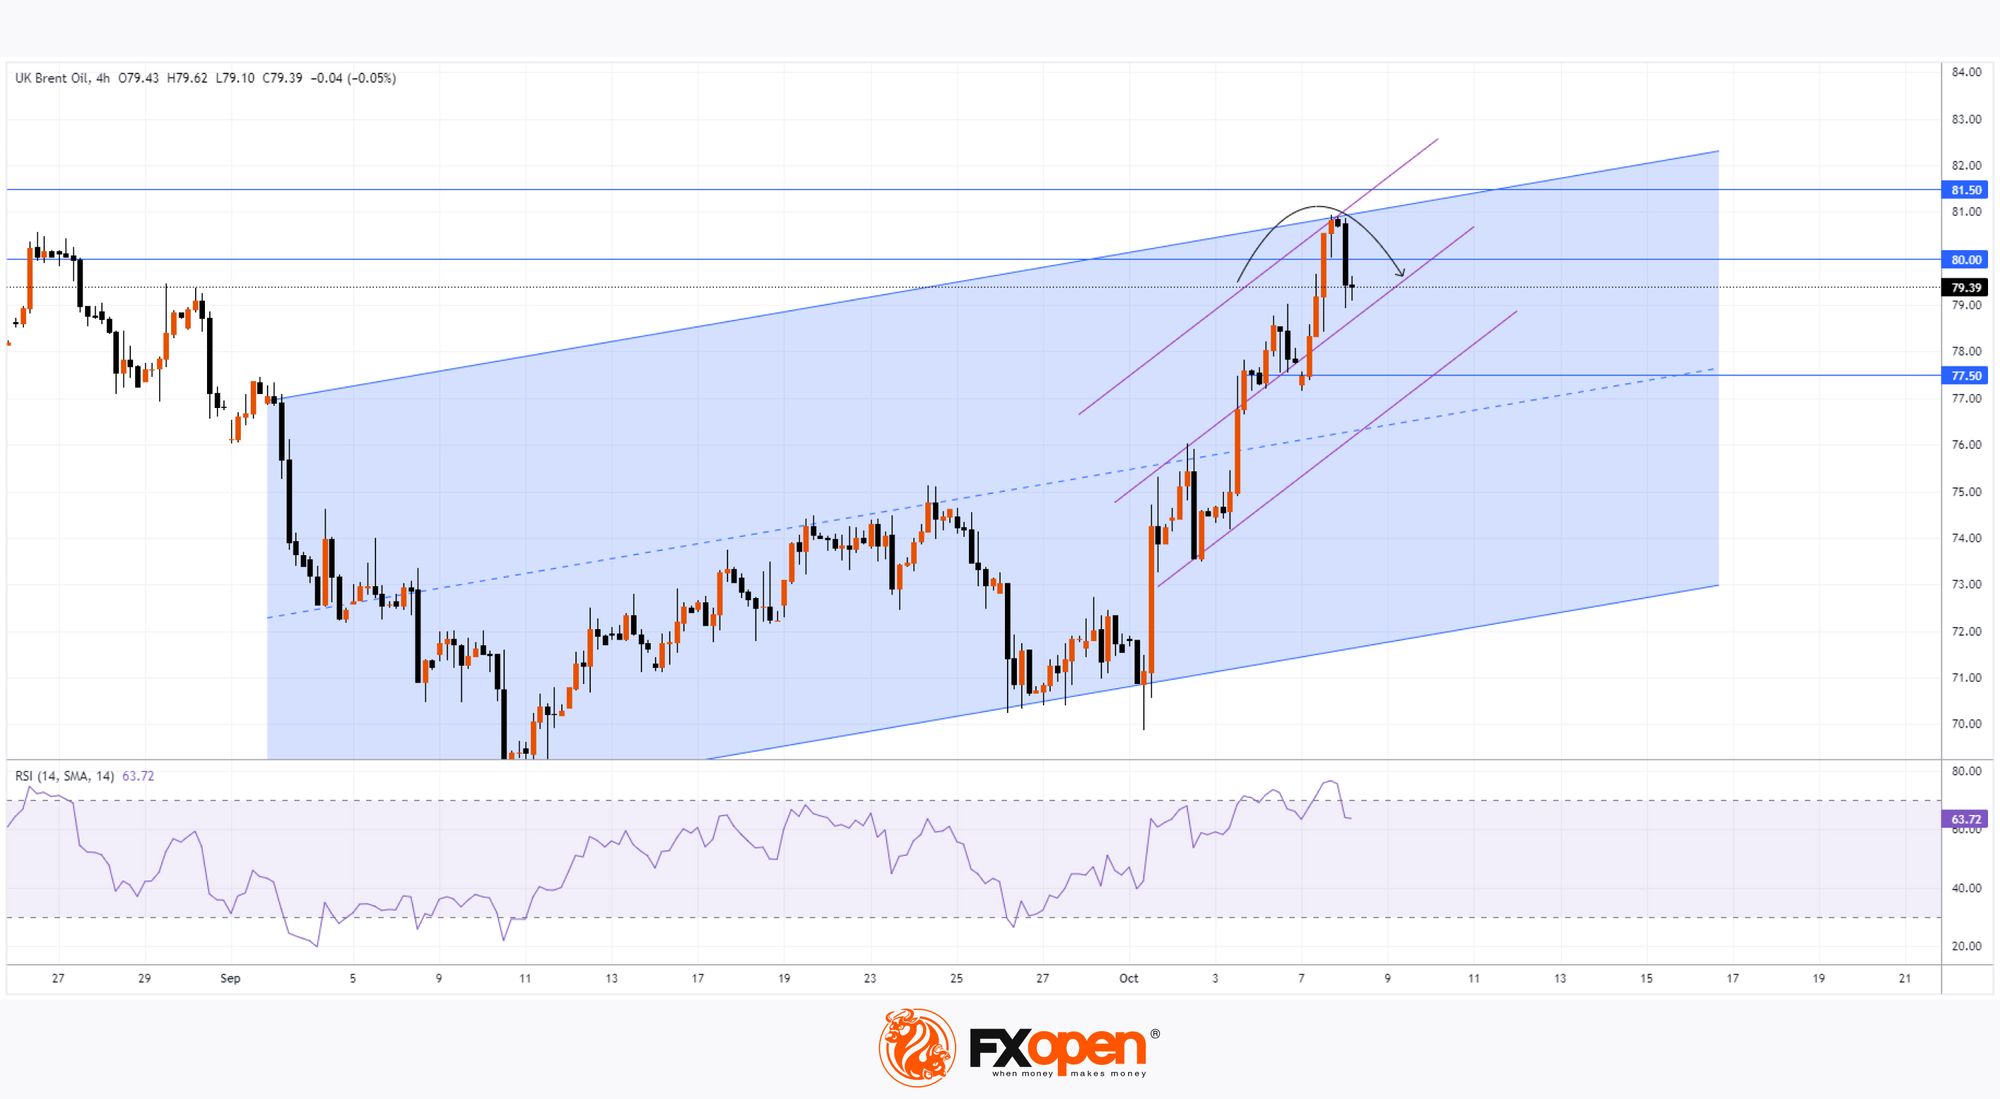
Today's analysis of the XBR/USD chart shows that Brent crude is moving within an upward channel (shown in blue) that began in the first half of September. The recent downturn (indicated by an arrow) comes as:
→ The price has entered a resistance zone, marked by the psychological $80 level and the August highs around $81.5.
→ The RSI indicator has risen above 85.
→ The price has touched the upper boundary of the channel.
If tensions in the Middle East ease, we could see a pullback on the XBR/USD chart following the impressive rally.
Brent crude prices may find support at the median line of the blue channel, the $77.50 level, and the purple lines marking last week’s strong price growth.
Trade over 50 forex markets 24 hours a day with FXOpen. Take advantage of low commissions, deep liquidity, and spreads from 0.0 pips (additional fees may apply). Open your FXOpen account now or learn more about trading forex with FXOpen.
This article represents the opinion of the Companies operating under the FXOpen brand only. It is not to be construed as an offer, solicitation, or recommendation with respect to products and services provided by the Companies operating under the FXOpen brand, nor is it to be considered financial advice.
Stay ahead of the market!
Subscribe now to our mailing list and receive the latest market news and insights delivered directly to your inbox.


Latest articles

Weak Data Weigh on the Dollar: Market Awaits Trend Confirmation
The US dollar is retreating from recent highs, moving into a moderate correction after a prolonged period of gains. Pressure on the currency is building amid weaker-than-expected macroeconomic data, while market participants adopt a wait-and-see approach ahead of key labour

Market Analysis: EUR/USD Aims Recovery While USD/JPY Gives Back Recent Gains
EUR/USD is recovering losses from 1.1450. USD/JPY is correcting gains from 160.50 and might decline further below 158.00.
Important Takeaways for EUR/USD and USD/JPY Analysis Today
· The Euro struggled to stay in a

European Currencies Decline: Pound Hits New Lows, Euro Under Pressure
European currencies continue to weaken against the US dollar amid rising geopolitical tensions and increased demand for safe-haven and liquid assets. Market participants are reducing exposure to riskier instruments, putting pressure on both the euro and the pound. Additional support