


FXOpen

On 21 November, we outlined a descending channel on the XBR/USD chart and noted that the bearish trend had been fuelled by easing geopolitical risks and hopes for an end to the war in Ukraine.
Ten days later, Brent crude is now trading above its late-November highs — once again driven by geopolitical developments.
Why is Oil Rising?
US President Donald Trump stated that the airspace over and around Venezuela “should be considered completely closed”. This immediately led to flight cancellations, created a de facto blockade, and raised the threat of military action in an oil-rich region. This risk premium is being priced into the current rally.
In addition, OPEC+ members have confirmed they will postpone the production increases planned for early 2026 — setting the stage for a potential supply deficit, especially if Venezuelan exports are disrupted.
XBR/USD Technical Analysis
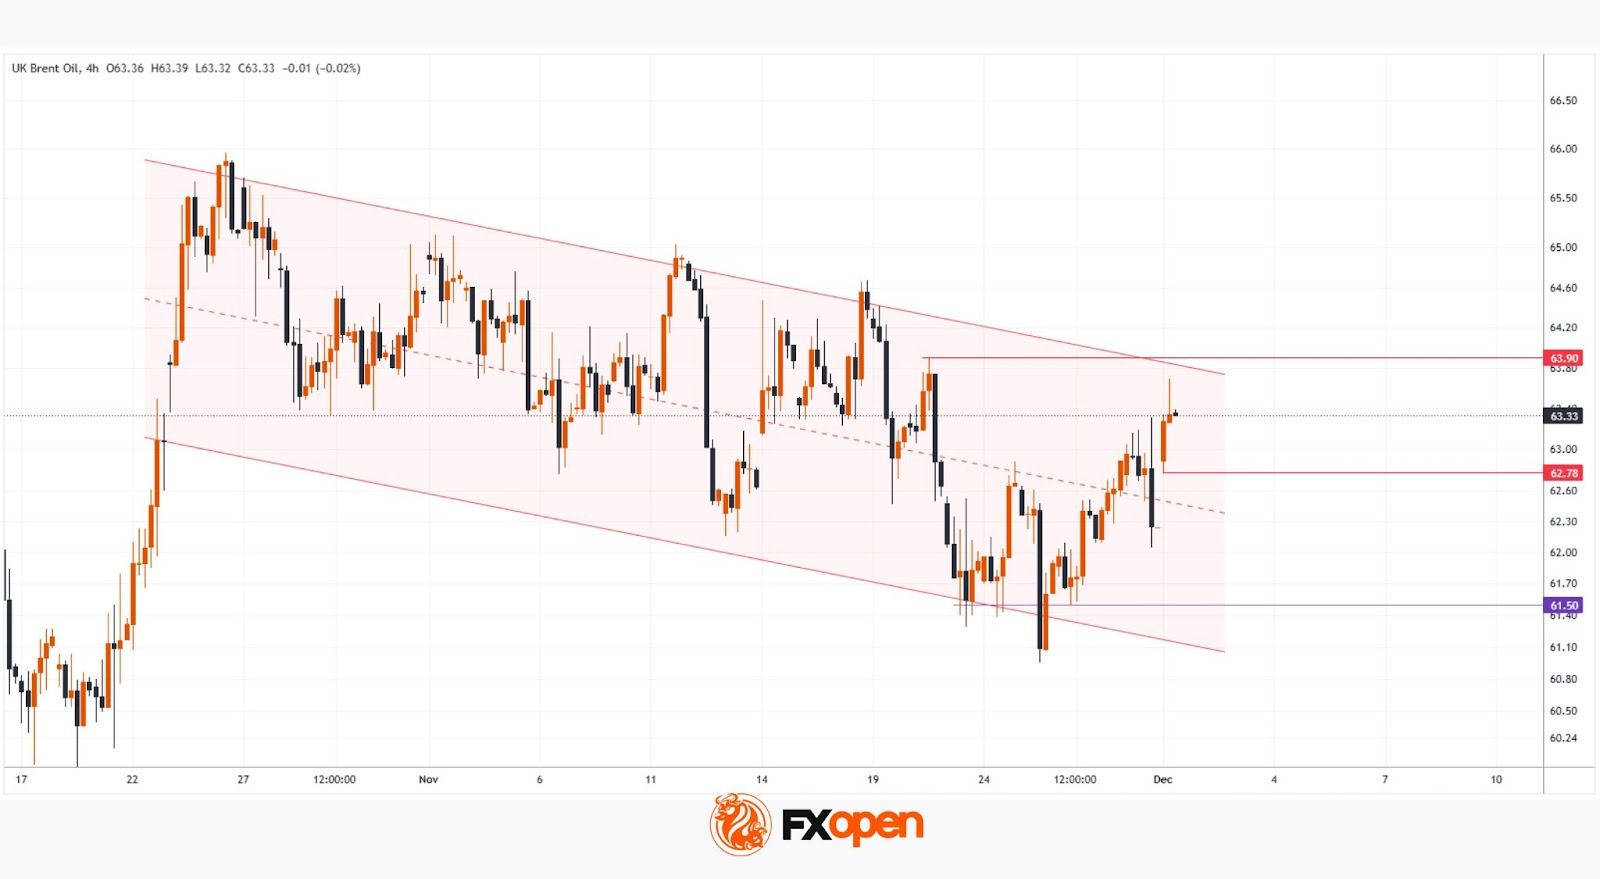
Although there was no further downside extension, the descending channel remains valid. The downward move was met with strong buying interest (evident from the long lower wicks on candles in late November around $61.50), triggering an upward reversal from the channel’s lower boundary.
This week opened with a bullish gap, followed by a large bullish candle on the 4-hour chart — a sign of limited selling pressure and market expectations of higher prices.
However, Brent’s advance may soon stall due to nearby resistance zones:
→ around $63.90 (the 20 November high);
→ at the upper boundary of the channel.
Should sellers regain control, support may be found in the area between:
→ the channel’s median line;
→ the lower edge of the gap at $62.78.
Start trading commodity CFDs with tight spreads (additional fees may apply). Open your trading account now or learn more about trading commodity CFDs with FXOpen.
This article represents the opinion of the Companies operating under the FXOpen brand only. It is not to be construed as an offer, solicitation, or recommendation with respect to products and services provided by the Companies operating under the FXOpen brand, nor is it to be considered financial advice.
Stay ahead of the market!
Subscribe now to our mailing list and receive the latest market news and insights delivered directly to your inbox.


Latest articles

FX Market Awaits Macro Data: EUR/USD and GBP/USD Near Range Boundaries
European currencies are trading without a clear direction against the US dollar, remaining in a consolidation phase following the earlier decline driven by USD strength. At the start of the week, both EUR/USD and GBP/USD attempted a recovery,

Market Analysis: AUD/USD, NZD/USD Struggle at Resistance, Upside Risks Diminish
AUD/USD is attempting a recovery wave from 0.6910. NZD/USD is also correcting losses and might recover if there is a clear move above 0.5885.
Important Takeaways for AUD/USD and NZD/USD Analysis Today
· The Aussie

Tesla (TSLA) Shares Surge Following Musk’s Announcements
According to the chart, Tesla (TSLA) shares had been under significant pressure since the start of 2026: from their December high, they had lost around 25% of their value. The main bearish drivers included:
→ Intense competition from Chinese automakers, particularly