


FXOpen

As shown on the XBR/USD chart, the price of Brent crude oil has pulled back from yesterday’s 4.5-month high following a statement from the White House that President Donald Trump will make a decision within the next two weeks on whether the United States will take part in the Israel-Iran conflict.
According to Reuters, the US President is facing backlash from some members of his team over the prospect of launching a strike against Iran, which could drag the US into yet another prolonged war.
Technical Analysis of the XBR/USD Chart
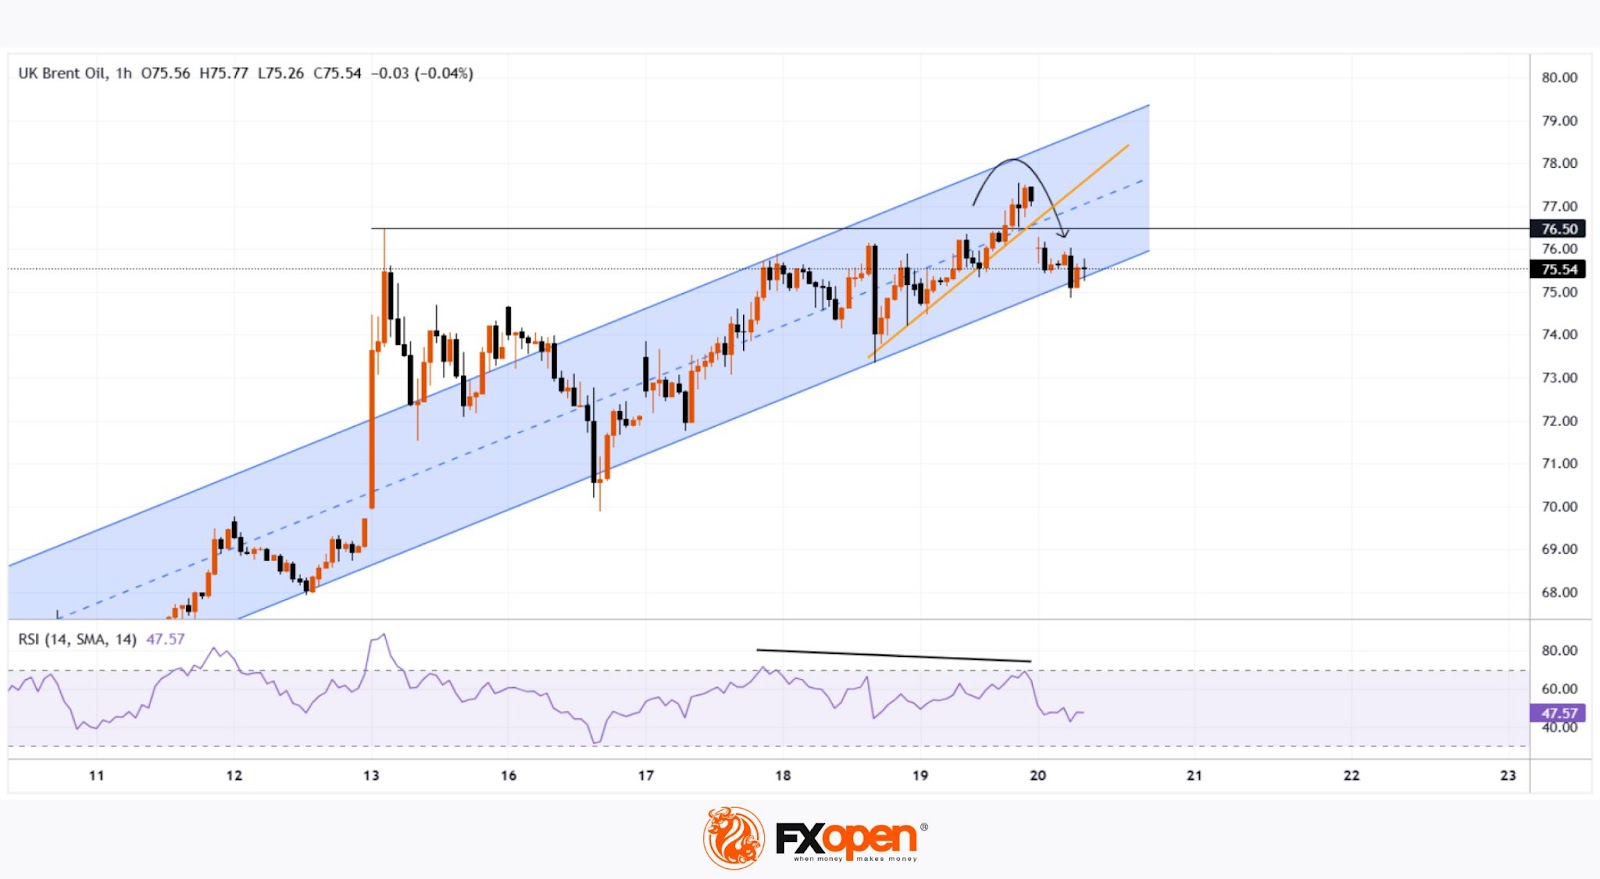
From a technical standpoint, Brent crude oil price is developing within an upward channel (marked in blue), though several bearish signals are appearing on the chart:
→ a bearish gap that formed overnight;
→ a false bullish breakout (indicated by an arrow) above the $76.50 level, drawn from the 13 June high;
→ bearish divergence on the RSI indicator;
→ a break of the recent local ascending trendline (marked in orange).
Given the steep angle of the rising blue channel, it is reasonable to assume that bears may attempt to break through its lower boundary, which is currently acting as support. Whether this scenario materialises in the oil market will largely depend on developments in the Middle East.
Start trading commodity CFDs with tight spreads (additional fees may apply). Open your trading account now or learn more about trading commodity CFDs with FXOpen.
This article represents the opinion of the Companies operating under the FXOpen brand only. It is not to be construed as an offer, solicitation, or recommendation with respect to products and services provided by the Companies operating under the FXOpen brand, nor is it to be considered financial advice.
Stay ahead of the market!
Subscribe now to our mailing list and receive the latest market news and insights delivered directly to your inbox.


Latest articles

European Currencies Strengthen: Dollar Under Pressure Following Ceasefire News
European currencies posted solid gains, while the US dollar came under pressure amid easing geopolitical tensions following reports of a two-week ceasefire agreement between the United States and Iran. Reduced demand for so-called safe-haven assets acted as the primary driver,

Brent Crude Price: Ceasefire Wipes Out the Geopolitical Premium
For several weeks, the oil market remained directly influenced by the US-Iran tensions. Threats to close the Strait of Hormuz kept Brent prices within the $97–110 range. Overnight on 8 April, the parties announced a two-week ceasefire, and the
