Potential Double Top Pattern May Drag USDCAD To 1.2120
The US Dollar (USD) extended downside movement against the Canadian Dollar (CAD) on Friday, decreasing the price of USDCAD to less than even 1.3090 ahead of some key economic events. The technical bias remains bullish because of a Higher High and Higher Low in the recent wave on daily chart. A potential double top pattern on daily chart might drag the pair towards the 1.2120 support area.
Technical Analysis
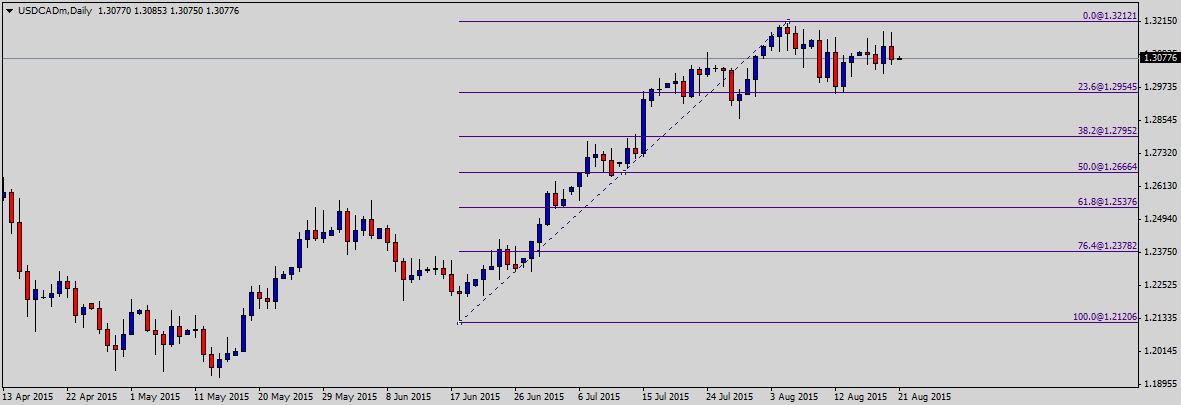
As of this writing, the pair is being traded around 1.3077. A hurdle may be noted near 1.3100, the psychological number ahead of 13212, the swing high of the last major upside rally as demonstrated in the following daily chart. A break and daily closing above the 1.3200-1.3212 resistance area could incite renewed buying interest, validating a move towards the 1.3500 resistance zone.
On the downside, the pair is likely to find a support around 1.2954-1.30000 support area which is the confluence of psychological number and 23.6% fib level and then 1.2666, the 50% fib level. The technical bias will remain bullish as long as the 1.2859 support area is intact. Not to mention, a potential double pattern is being emerged on the daily chart which is yet to be confirmed through a breakout of neckline.
Canada Inflation
The Bank of Canada (BoC) is due to release the Canada’s Consumer Price Index (CPI) report today during the early New York session. The report is considered a key gauge for inflation. According to the average forecast of different economist, the rate of inflation in Canada remained 1.4% in July as compared to 1% in the month before. Generally speaking, higher inflation is considered positive for the developed economies like Canada.
Trade Idea
Considering the overall technical and fundamental outlook, selling the pair could be a good strategy if the price breaks the neckline of double top pattern on daily chart. The neckline is sitting in around 1.2950 support area.