


FXOpen

EUR/USD
The euro strengthened on Monday as the dollar fell on expectations that the Federal Reserve will not raise rates again. Traders this week will have to weigh data on how the US economy performed in the third quarter, as well as key data on consumer inflation and spending, both of which could play an important role in setting expectations for the timing of the first rate cut.
The focus this week will be Thursday's October US Personal Consumption Expenditures Price Index (PCE) report, which is said to be the Fed's preferred measure of inflation, as well as eurozone consumer inflation data for greater clarity on where prices and monetary policy are heading. According to the EUR/USD technical analysis, the nearest resistance can be seen at 1.1023, a breakout to the upside could trigger a rise to 1.1046. On the downside, immediate support is seen at 1.0966, a break below could take the pair towards 1.0924.

At the highs of the week, a new ascending channel has formed. Now, the price has moved away from the upper border of the channel and may continue its corrective decline.
GBP/USD
The British pound held near its highest level in nearly three months on Tuesday and remains on course for its biggest monthly gain in a year against the dollar, as robust data and a message of higher and longer-term rates supported the currency. Bank of England Deputy Governor Dave Ramsden told a conference in Hong Kong on Tuesday that monetary policy must remain contractionary for some time to beat inflation, pouring cold water on the idea that interest rate cuts are imminent. The currency rose nearly 4% in November, its biggest monthly gain since rising more than 5% in November last year. On the GBP/USD chart, the nearest resistance can be seen at 1.2713, a break upward could trigger a rise to 1.2747. On the downside, immediate support is seen at 1.2590, a break below could take the pair towards 1.2536.
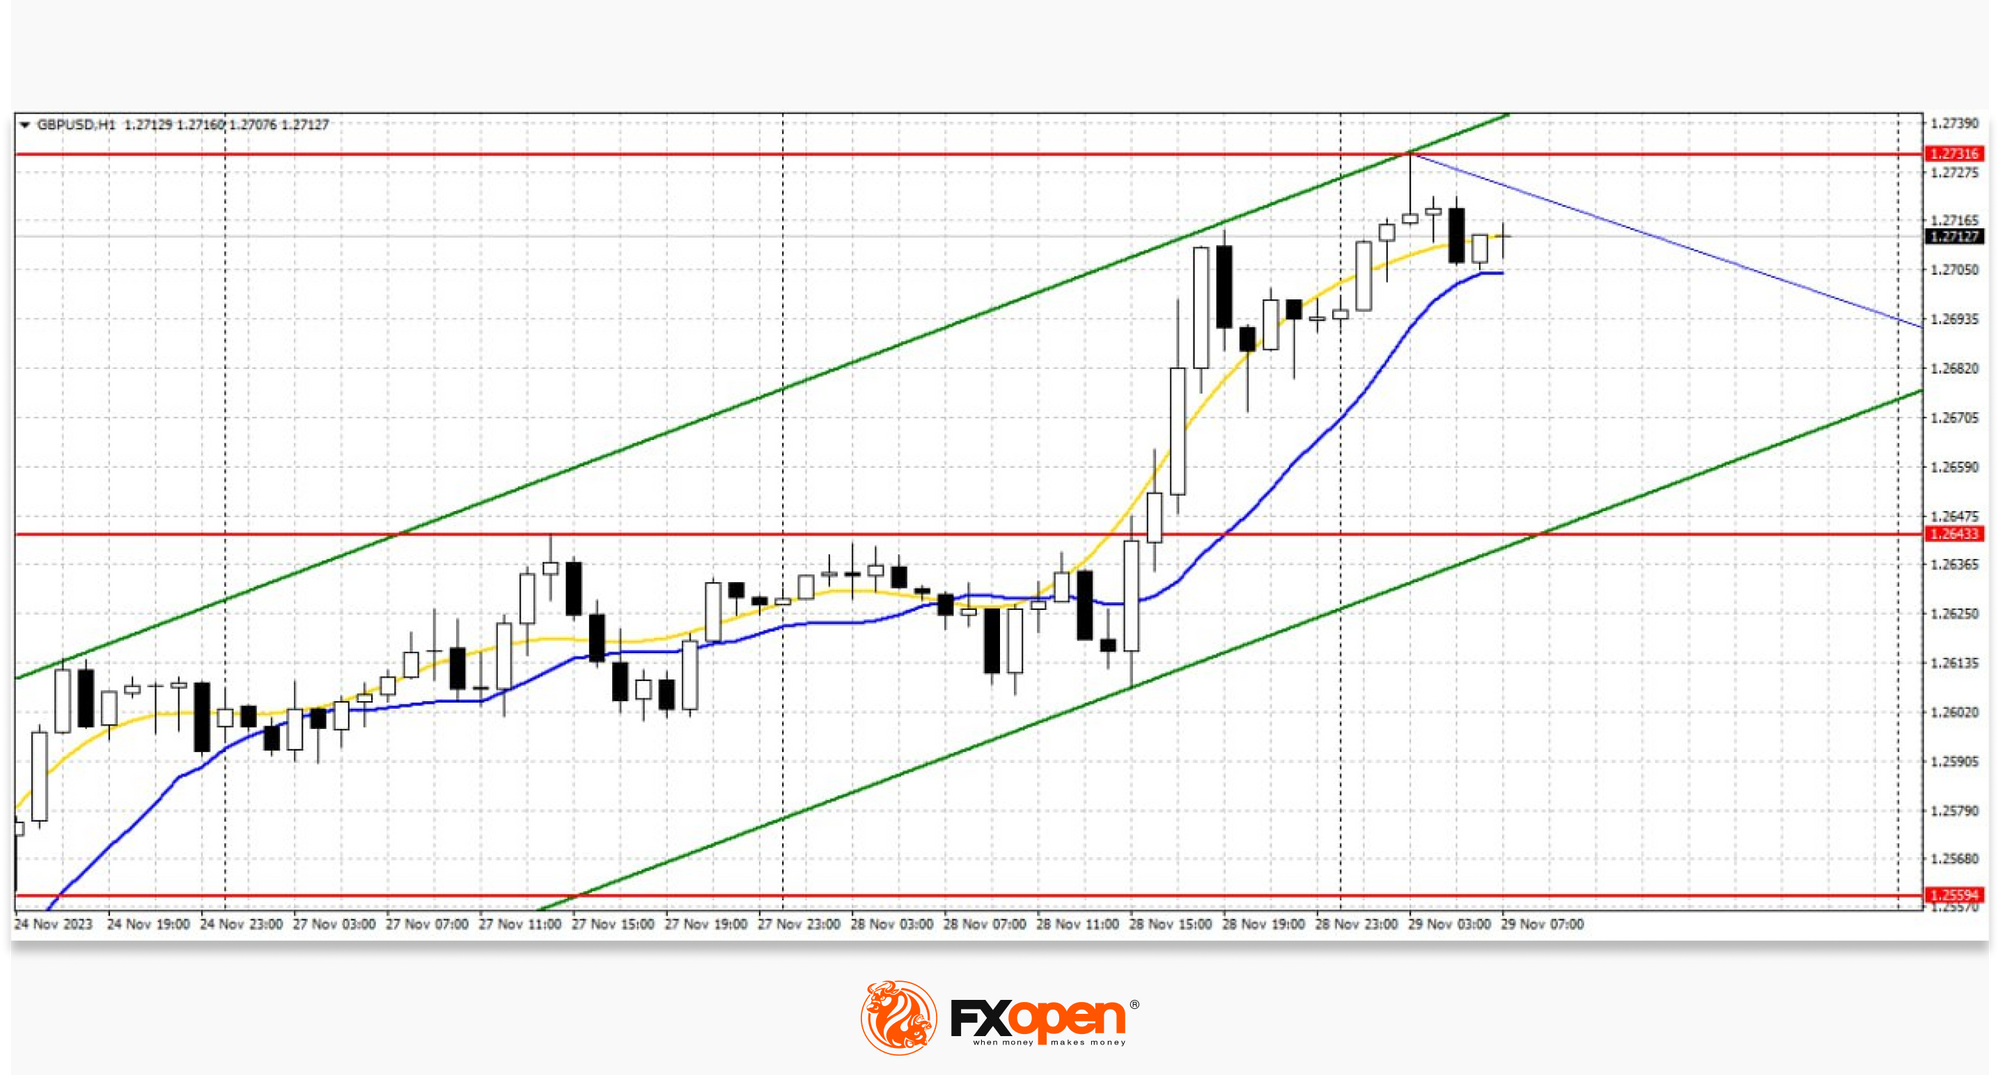
At the highs of this week, a new ascending channel has formed. Growth may continue after the correction.
USD/JPY
The dollar fell against the yen on Tuesday as the Federal Reserve's rate decisions weighed on the greenback. Investors are also awaiting US Personal Consumer Expenditures (PCE) data on Thursday. Revised US GDP data for the third quarter are also expected, due to be published on Wednesday. On the USD/JPY chart, strong resistance can be seen at 147.72, which represents upside potential. A breakout could trigger a rally towards 148.38. In case of a fall, the nearest support appears to be 146.97. A break below could take the pair towards 146.63.
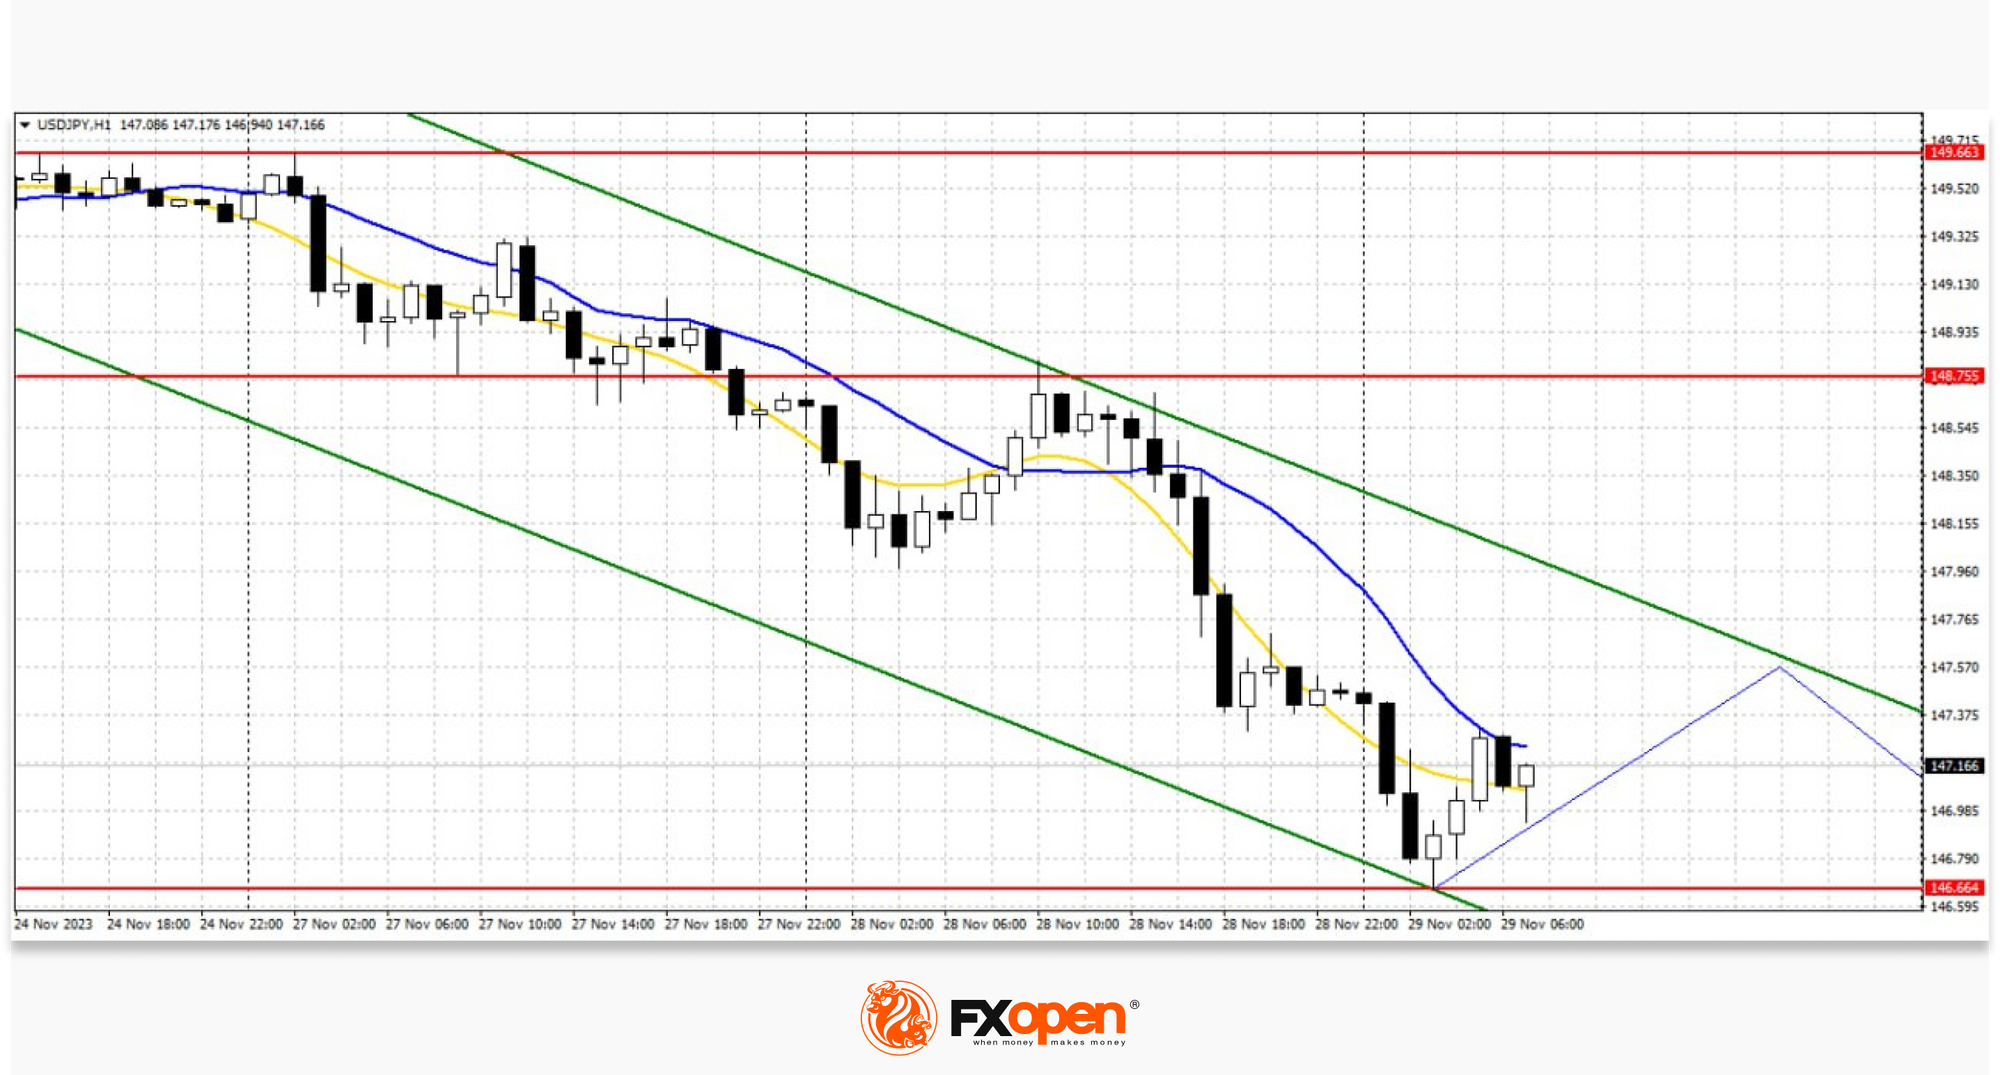
At the lows of the week, a new downward channel has formed. Now, the price is in the middle of the channel and may continue to decline after approaching the upper limit.
Trade over 50 forex markets 24 hours a day with FXOpen. Take advantage of low commissions, deep liquidity, and spreads from 0.0 pips (additional fees may apply). Open your FXOpen account now or learn more about trading forex with FXOpen.
This article represents the opinion of the Companies operating under the FXOpen brand only. It is not to be construed as an offer, solicitation, or recommendation with respect to products and services provided by the Companies operating under the FXOpen brand, nor is it to be considered financial advice.
Stay ahead of the market!
Subscribe now to our mailing list and receive the latest market news and insights delivered directly to your inbox.


Latest articles

Weak Data Weigh on the Dollar: Market Awaits Trend Confirmation
The US dollar is retreating from recent highs, moving into a moderate correction after a prolonged period of gains. Pressure on the currency is building amid weaker-than-expected macroeconomic data, while market participants adopt a wait-and-see approach ahead of key labour

Market Analysis: EUR/USD Aims Recovery While USD/JPY Gives Back Recent Gains
EUR/USD is recovering losses from 1.1450. USD/JPY is correcting gains from 160.50 and might decline further below 158.00.
Important Takeaways for EUR/USD and USD/JPY Analysis Today
· The Euro struggled to stay in a

European Currencies Decline: Pound Hits New Lows, Euro Under Pressure
European currencies continue to weaken against the US dollar amid rising geopolitical tensions and increased demand for safe-haven and liquid assets. Market participants are reducing exposure to riskier instruments, putting pressure on both the euro and the pound. Additional support