


FXOpen

The US dollar is weakening against the euro, yen and pound. In February, the core personal consumption expenditure index fell from 0.5% to 0.3% on a monthly basis and from 2.9% to 2.8% on an annual basis, justifying preliminary estimates. Thus, the slowdown in inflationary pressure continues at a steady pace, convincing investors that the US Federal Reserve will keep interest rates the same in May and begin lowering them in June. In addition, personal income increased by 0.3%, less than expected by 0.4%, and expenses by 0.8%, significantly exceeding the expected 0.5%: this may mean continued risks of rising consumer prices, but for now investors don't pay any attention to these statistics.
EUR/USD
The EUR/USD pair is moving in a narrow range around the 1.0780 level. Immediate resistance can be seen at 1.0860, a break higher could trigger a rise towards 1.0880. On the downside, immediate support is seen at 1.0768, a break below could take the pair towards 1.0750.
Market activity is reduced because Friday was a public holiday in most eurozone countries, so financial institutions are closed and investor activity is reduced. However, market participants were monitoring comments from European Central Bank (ECB) officials regarding its future actions. Thus, the head of the Bank of France, François Villeroy de Galhau, said that the regulator will probably start with a moderate reduction in interest rates, but it does not matter much whether this happens in April or June. The official added that after the first cut in borrowing costs, it would not necessarily continue at the next ECB meeting. This position coincides with the expectations of most economists surveyed by Reuters.
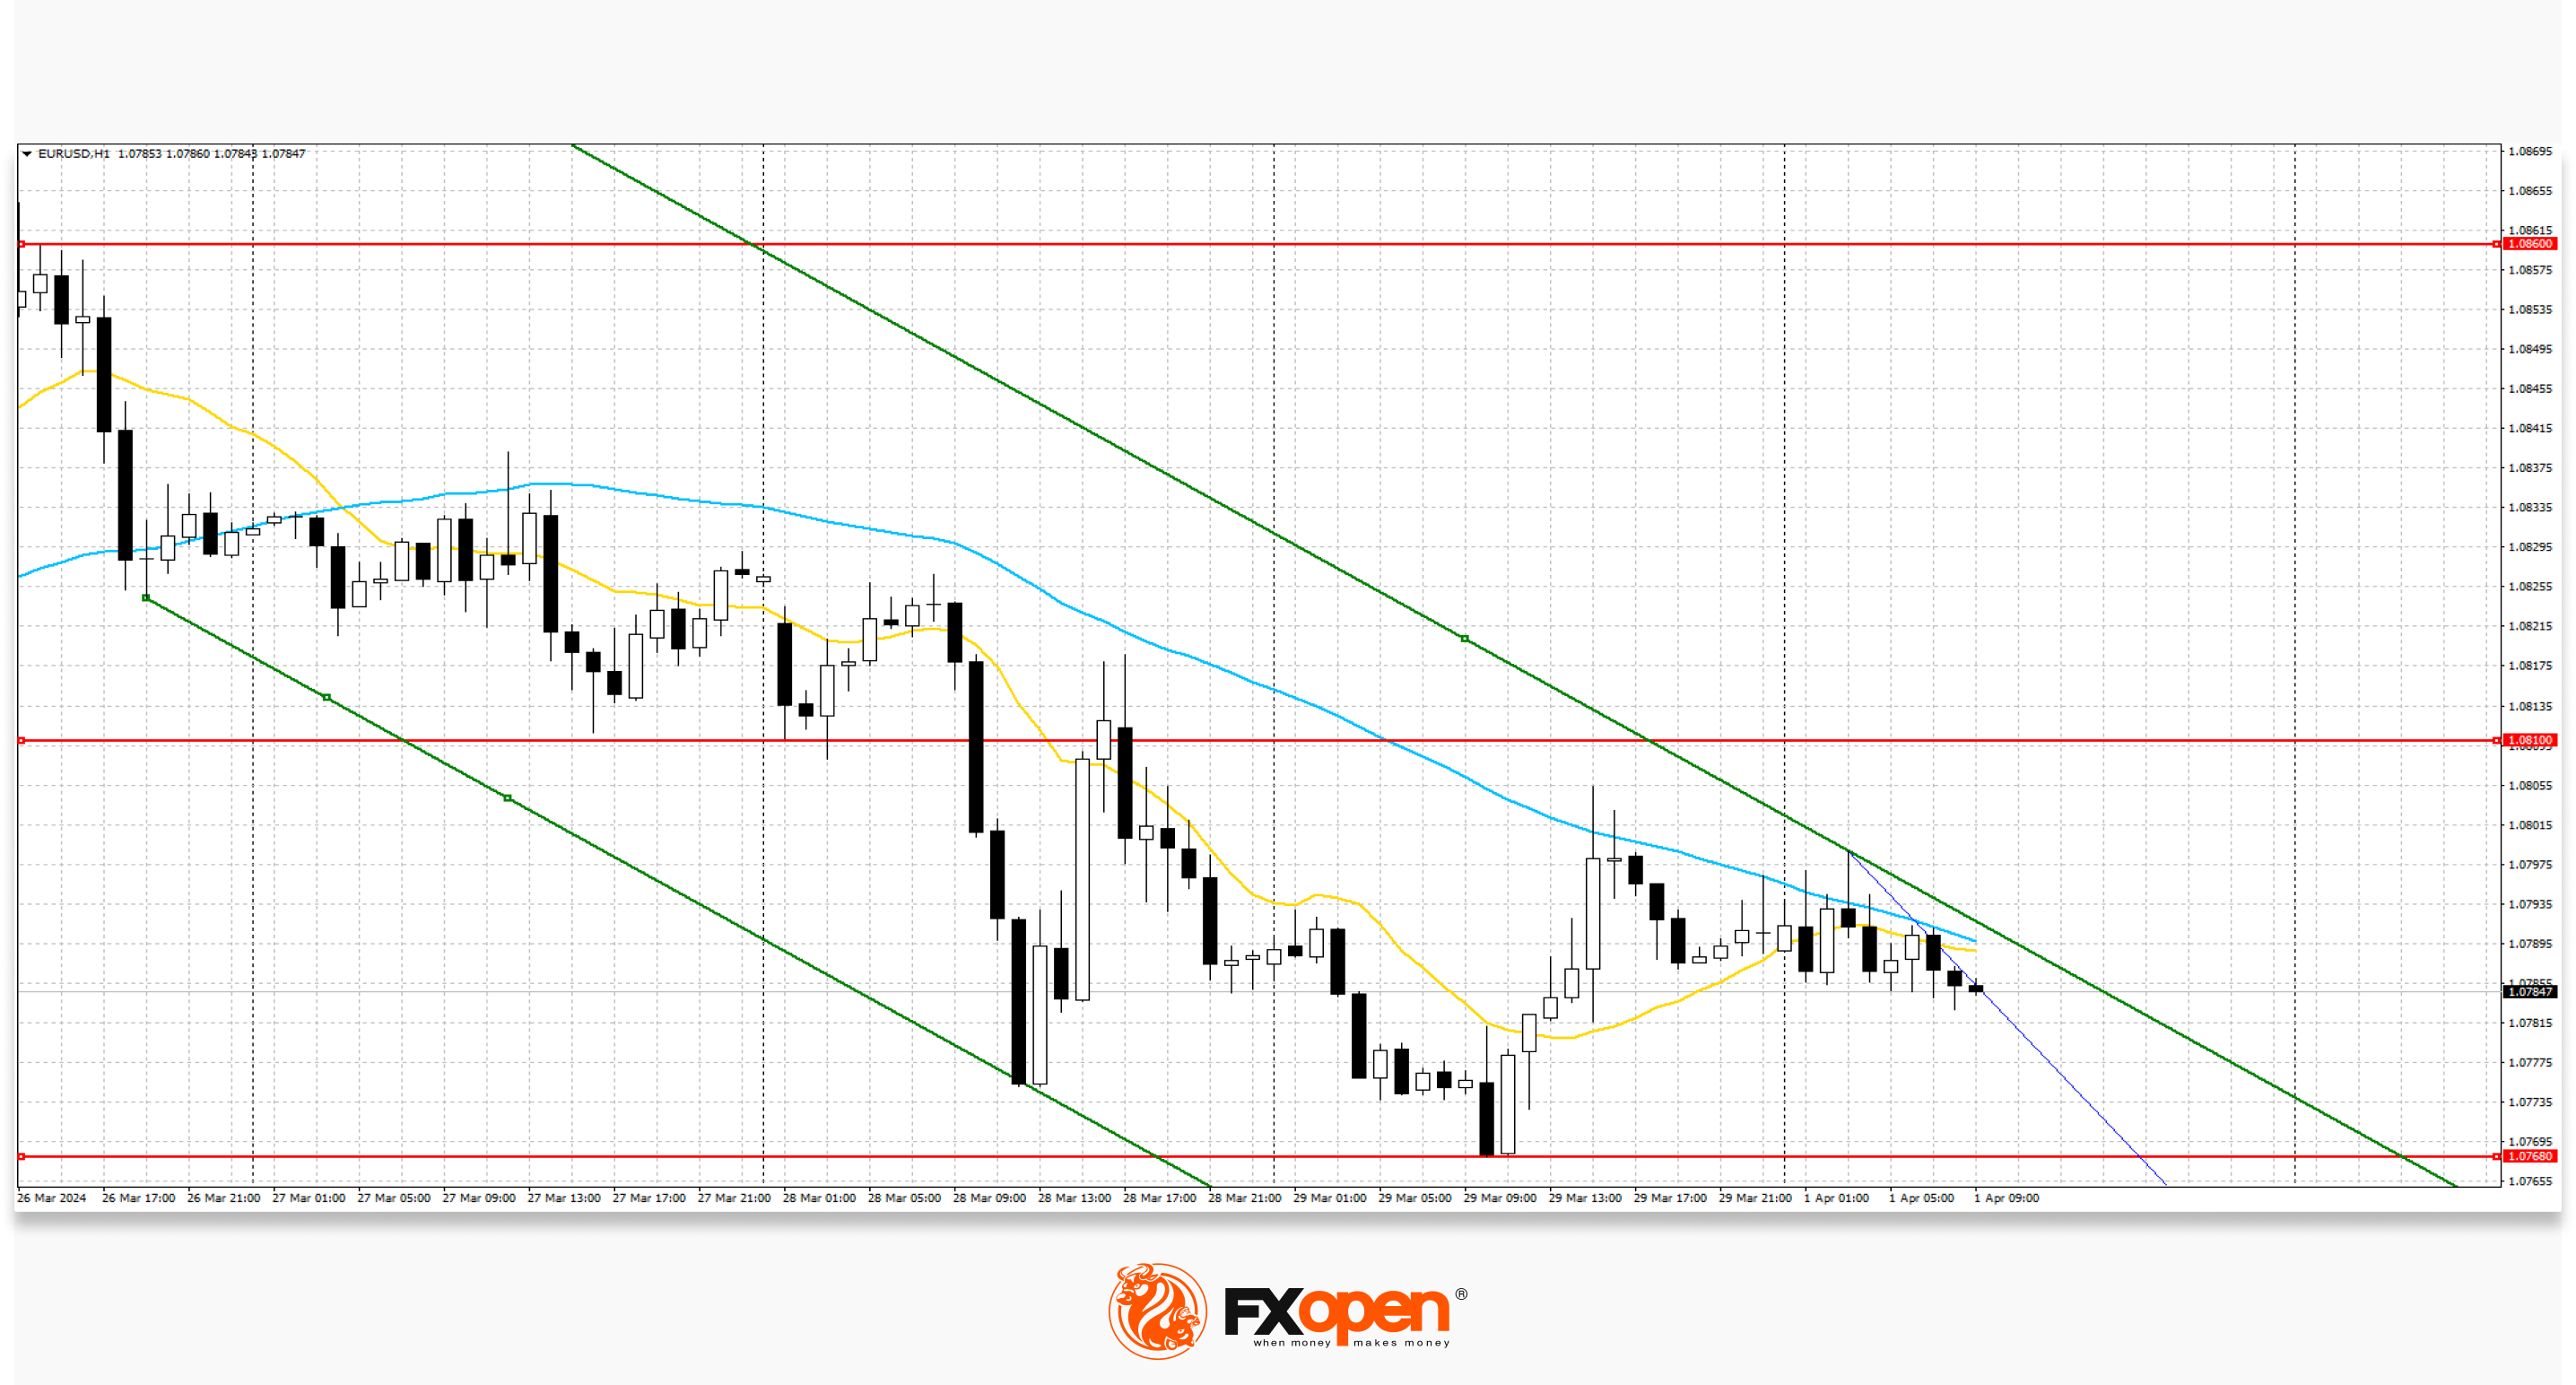
Based on the technical analysis of EUR/USD, a new downward channel has formed at the lows of last week. It is now in the middle of the channel and may continue to decline.
GBP/USD
The GBP/USD pair is consolidating around the 1.2630 level. Immediate resistance can be seen at 1.2645, a break higher could trigger a rise towards 1.2668. On the downside, immediate support is seen at 1.2610, a break below could take the pair towards 1.2586.
During holidays, market activity is reduced. Bank of England board member Jonathan Haskell said that despite the overall slowdown in inflation, underlying consumer price growth remains high, so it is premature to adjust monetary policy. The official is a hawk and one of the few representatives of the regulator who, back in January, allowed a new increase in borrowing costs. According to a March survey of British citizens on inflation expectations conducted by Citigroup Inc. together with YouGov Plc., the majority of respondents expect that in 12 months the increase in consumer prices in the country will be 3.3% instead of 3.6% as previously expected, and forecasts for an increase in the indicator over 5-10 years have decreased from 3.5%. up to 3.4%.
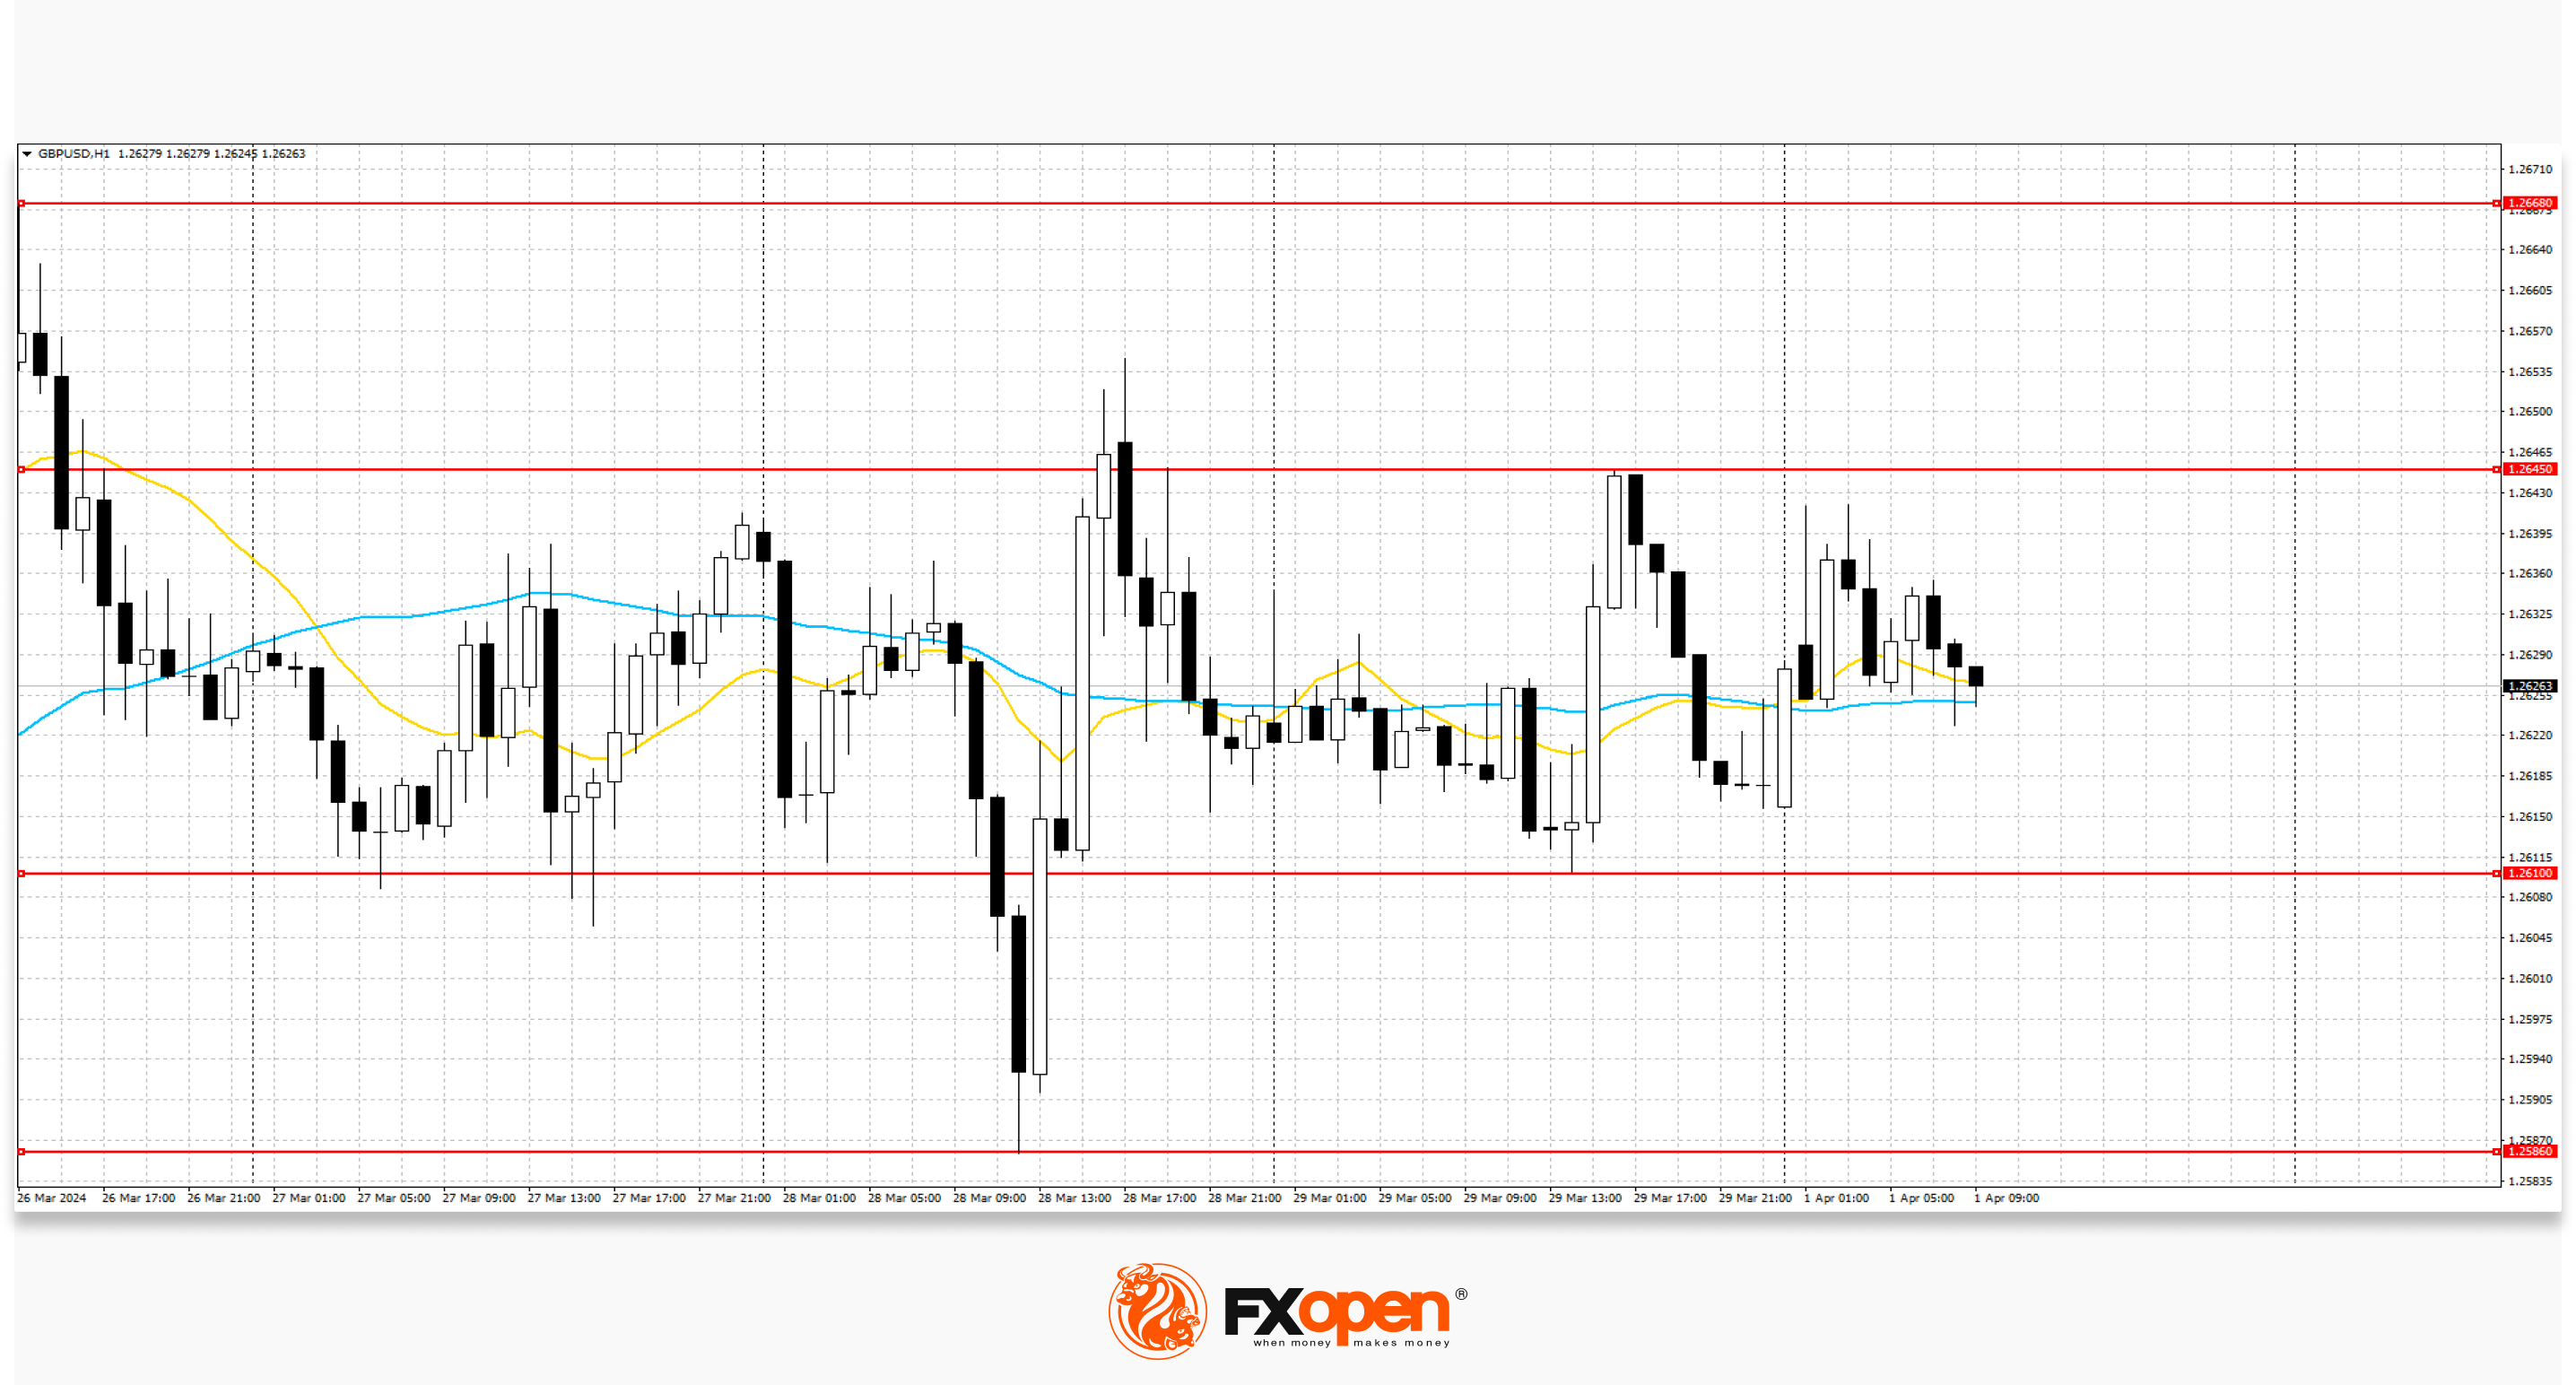
Over the past week, a trading range has formed on the GBP/USD chart with boundaries of 1.2645 and 1.2586. Now the price is in the middle of the range and the horizontal movement may continue.
USD/JPY
The USD/JPY pair shows mixed dynamics, holding near the 151.40 mark. Strong resistance can be seen at 151.55, a break higher could trigger a rise towards 151.97. On the downside, immediate support on the USD/JPY chart is seen at 151.16. A break below could take the pair towards 148.91.
The Tokyo metropolitan region's consumer price index remained at 2.6% year on year, but the core rate fell from 2.5% to 2.4%: although overall inflation in the country's most economically developed region is above target 2, 0%, experts see its slowdown as a negative signal. Preliminary data showed industrial output contracted 0.1% in February instead of an expected 1.2% rise, confirming the weakening domestic economy and raising concerns among investors that the Bank of Japan will take a significant break in its monetary tightening cycle.
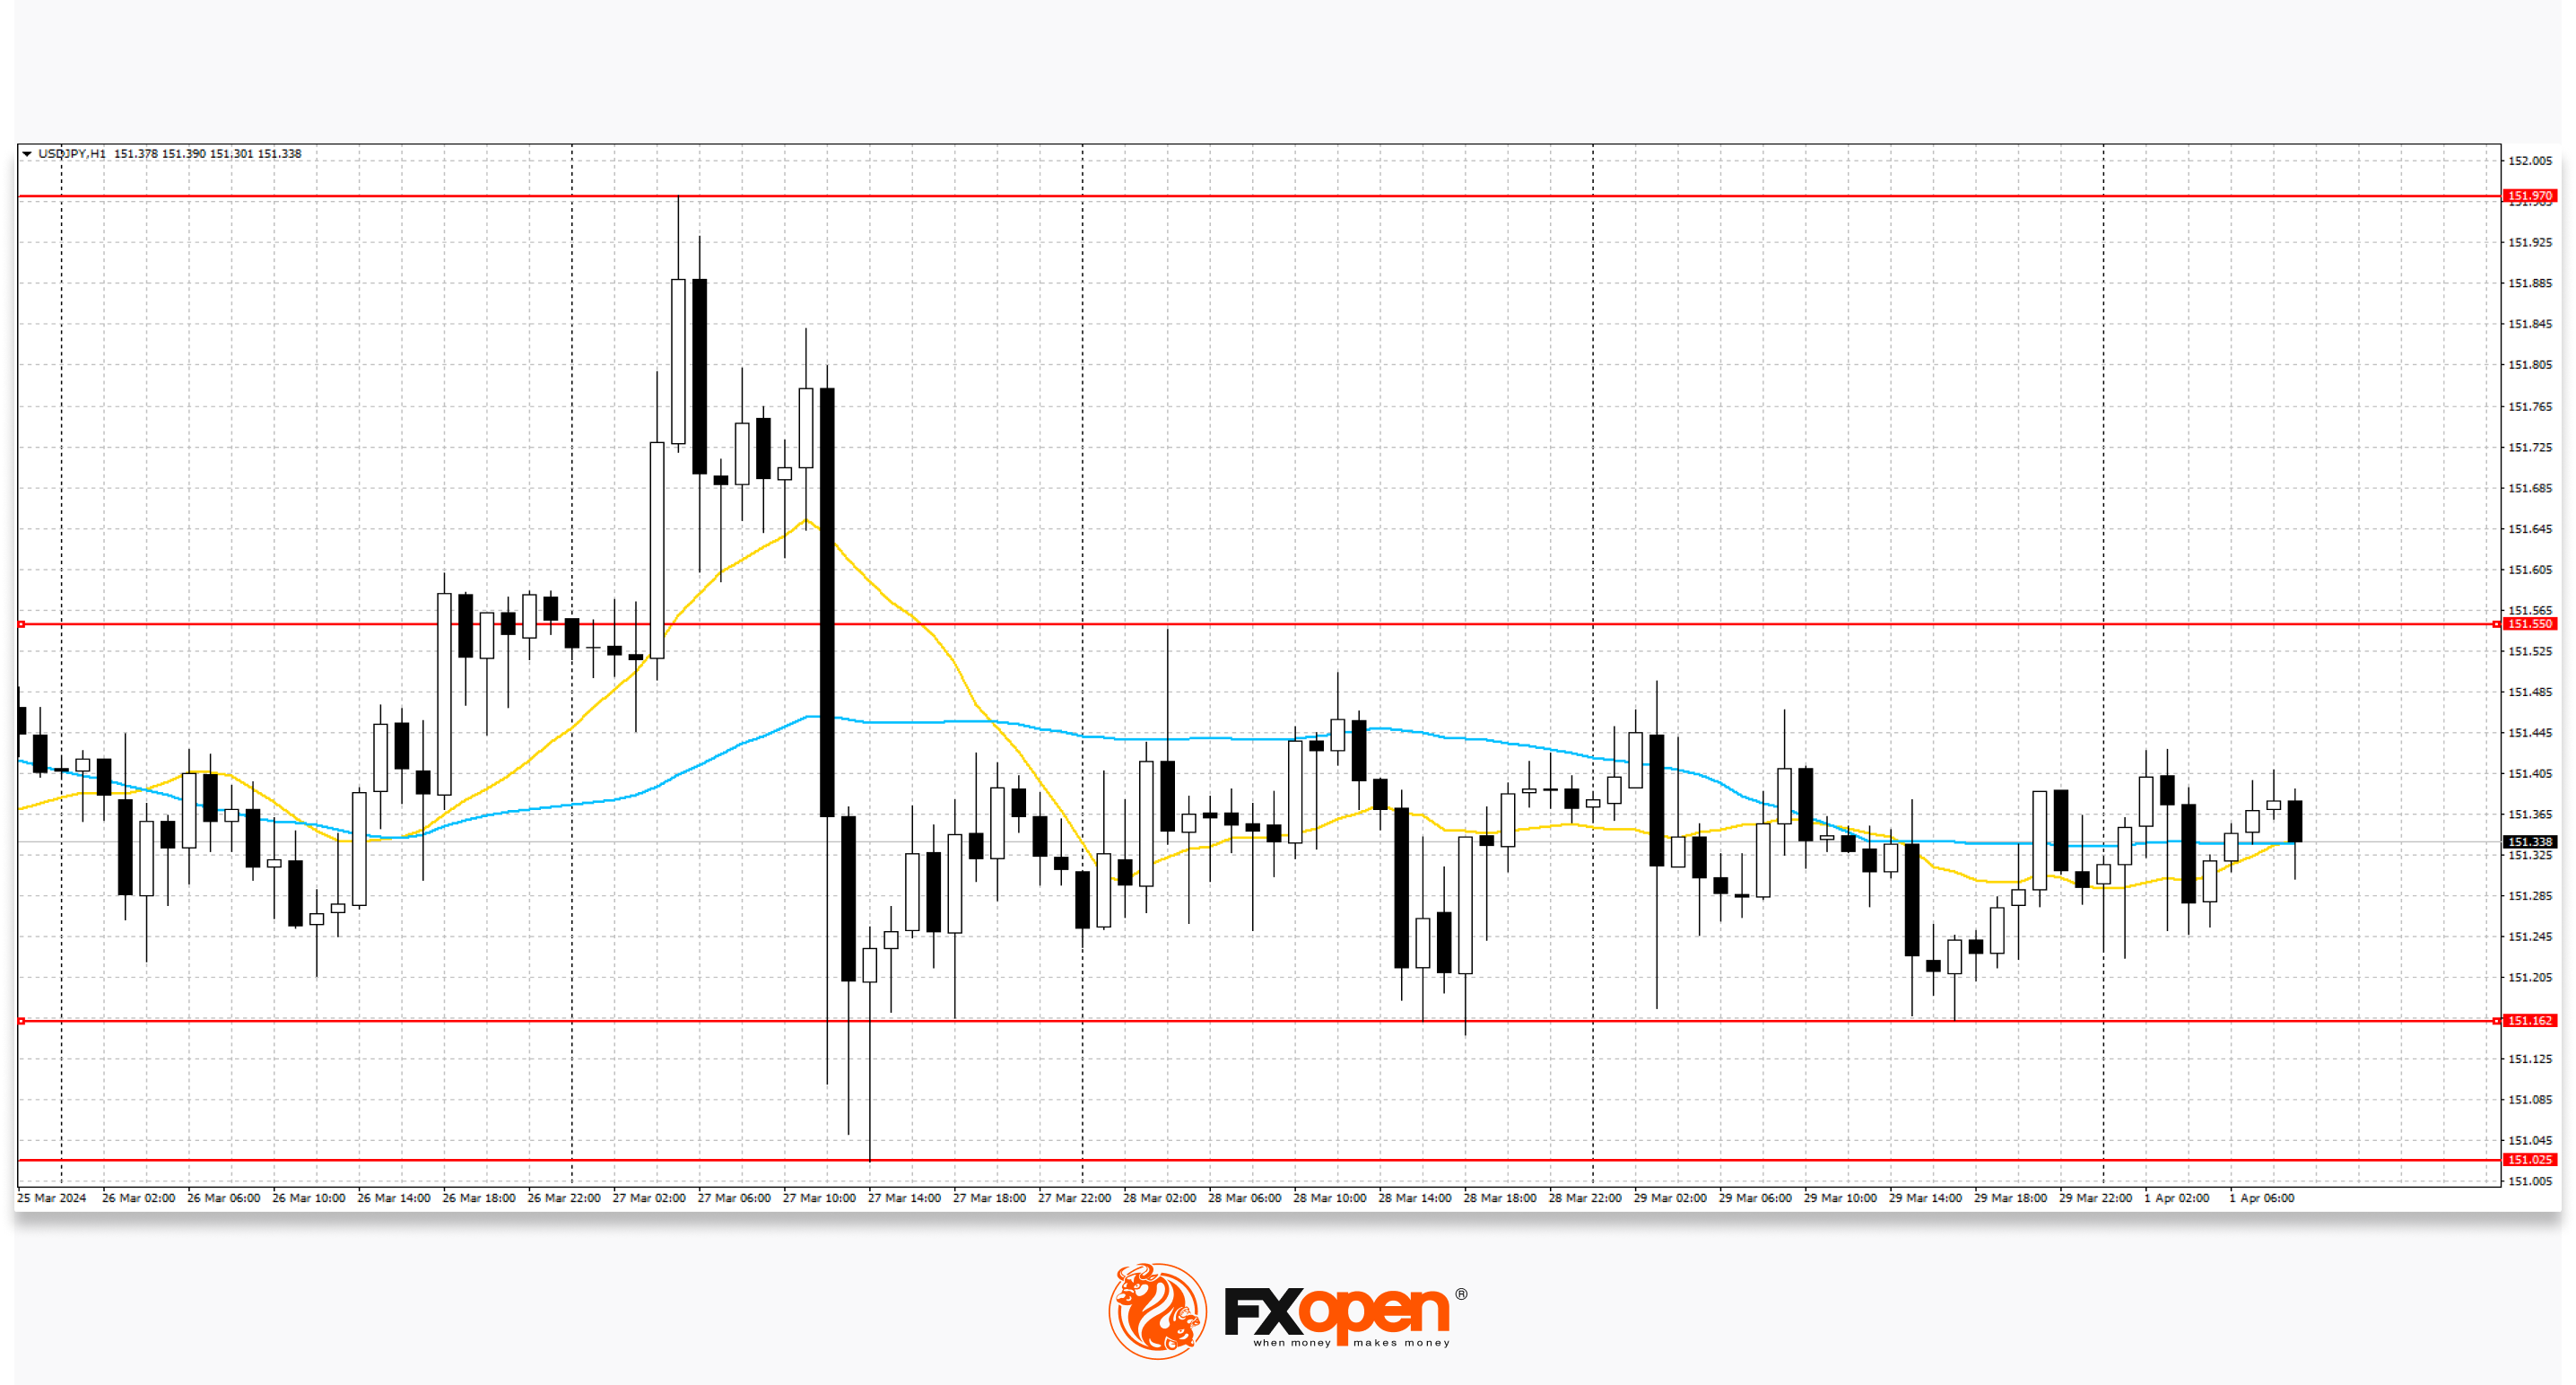
Over the past week, a trading range has formed with boundaries of 151.97 and 151.02. Now the price is in the middle of the range and this trend may continue.
Trade over 50 forex markets 24 hours a day with FXOpen. Take advantage of low commissions, deep liquidity, and spreads from 0.0 pips (additional fees may apply). Open your FXOpen account now or learn more about trading forex with FXOpen.
This article represents the opinion of the Companies operating under the FXOpen brand only. It is not to be construed as an offer, solicitation, or recommendation with respect to products and services provided by the Companies operating under the FXOpen brand, nor is it to be considered financial advice.
Stay ahead of the market!
Subscribe now to our mailing list and receive the latest market news and insights delivered directly to your inbox.


Latest articles

Consolidation Ahead of NFP: Commodity Currencies Search for Direction
Commodity-linked currencies have entered a consolidation phase following recent directional moves, as market participants adopt a wait-and-see approach ahead of key US labour market data. Current price action reflects a balance between ongoing demand for the US dollar and attempts

The Real Driver Behind the Dollar Rally: Market Insights with Gary Thomson
The US dollar has been firm, but the drivers behind the move may be more complex than they first appear.
While geopolitical tension and shifts in risk sentiment play a role, current price behaviour seems increasingly influenced by inflation expectations

EUR/USD and USD/CHF Pull Back: Market Reacts to Fundamentals
European currencies have shown a recovery in recent trading sessions after their recent decline, displaying early signs of a reversal. The US dollar is weakening amid expectations surrounding upcoming US macroeconomic data, while market participants are reassessing their short-term positions