


Technical Analysis for April 12: GBP/USD Starts Fresh Increase While EUR/GBP Eyes Upside Break
FXOpen

GBP/USD started a fresh increase above the 1.2400 resistance zone. EUR/GBP is struggling and facing resistance near 0.8790.
Important Takeaways for GBP/USD and EUR/GBP
- The British Pound started a fresh increase above the 1.2400 barrier against the US Dollar.
- There was a break above a key bearish trendline with resistance near 1.2410 on the hourly chart of GBP/USD.
- EUR/GBP is struggling to break the 0.8790 resistance zone.
- There is a major bullish trendline forming with support near 0.8770 on the EUR/GBP hourly chart.
GBP/USD Technical Analysis
This past week, the British Pound saw a downside correction below the 1.2400 support against the US Dollar. The GBP/USD pair tested the 1.2345 zone before the bulls took a stand.
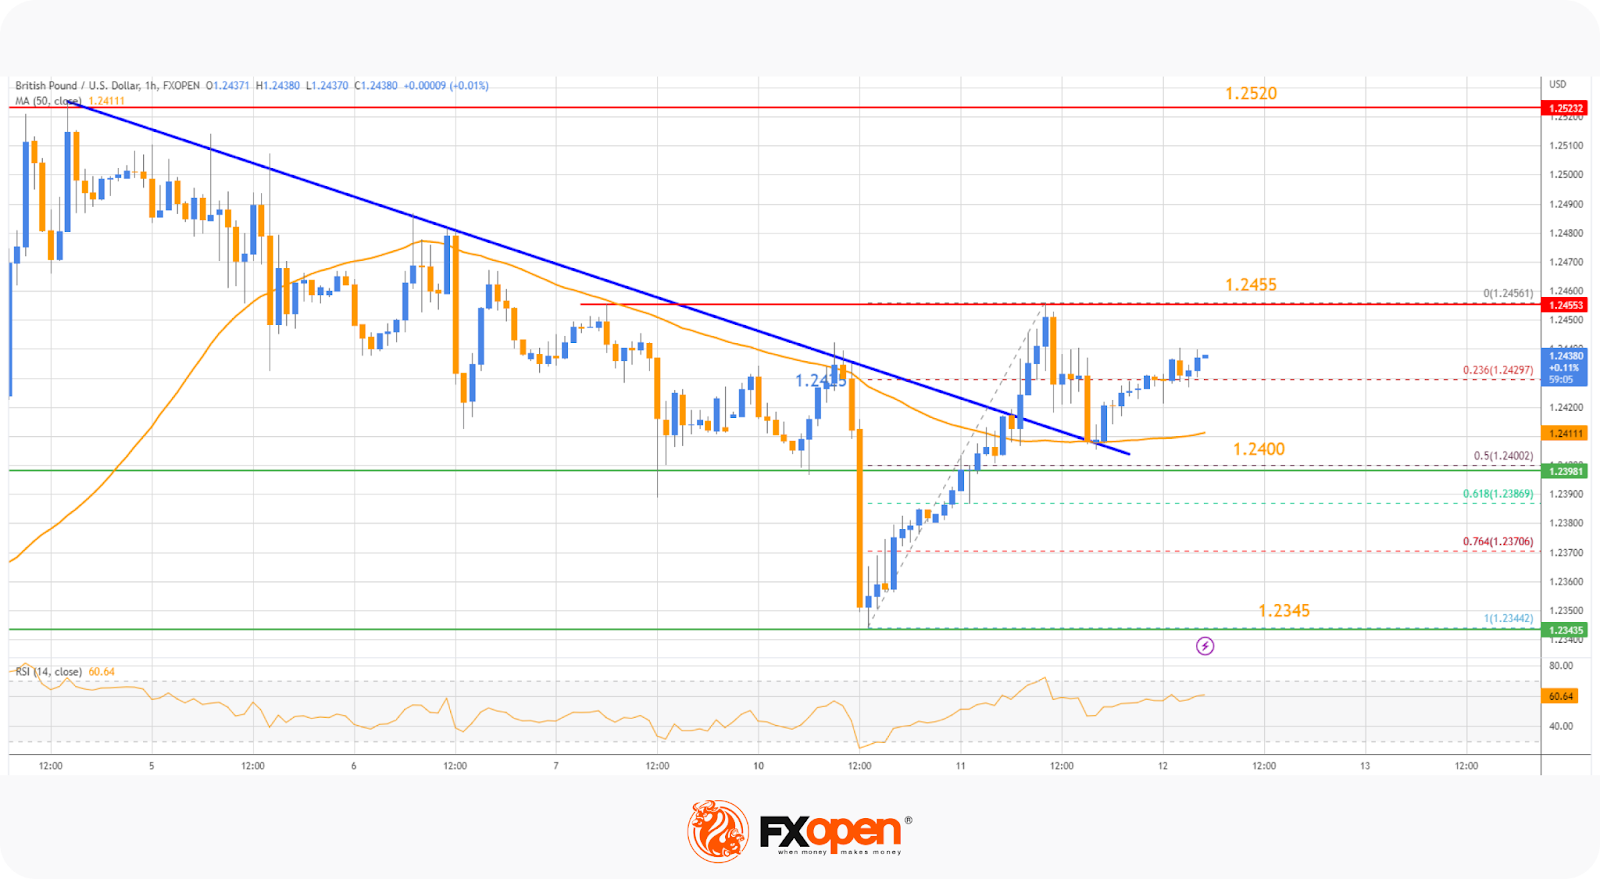
On the hourly chart at FXOpen, a low was formed near 1.2344, and the pair started a fresh increase. There was a clear move above the 1.2400 resistance zone. More importantly, there was a break above a key bearish trendline with resistance near 1.2410.
The pair traded at 1.2456 and settled above the 50-hour simple moving average. There was a minor downside correction below the 23.6% Fib retracement level of the upward move from the 1.2027 swing low to the 1.2205 high.
However, the pair remained well-bid above the 50% Fib retracement level at 1.2400.
If there is a downside break below the 1.2400 support, there is a risk of a sharp decline. In the stated case, GBP/USD may revisit the 1.2355 support. Any more losses could lead the pair toward 1.2300.
On the upside, resistance is near the 1.2355 level, above which the pair might resume its increase (considering the RSI is above 50). The next major resistance is near the 1.2520 level. A clear move above 1.2520 could trigger a rally toward 1.2600.
EUR/GBP Technical Analysis
On the hourly chart at FXOpen, the Euro traded in a small range below the 0.8790 resistance zone against the British Pound. The EUR/GBP pair made a couple of attempts to break the 0.8790 resistance but failed.
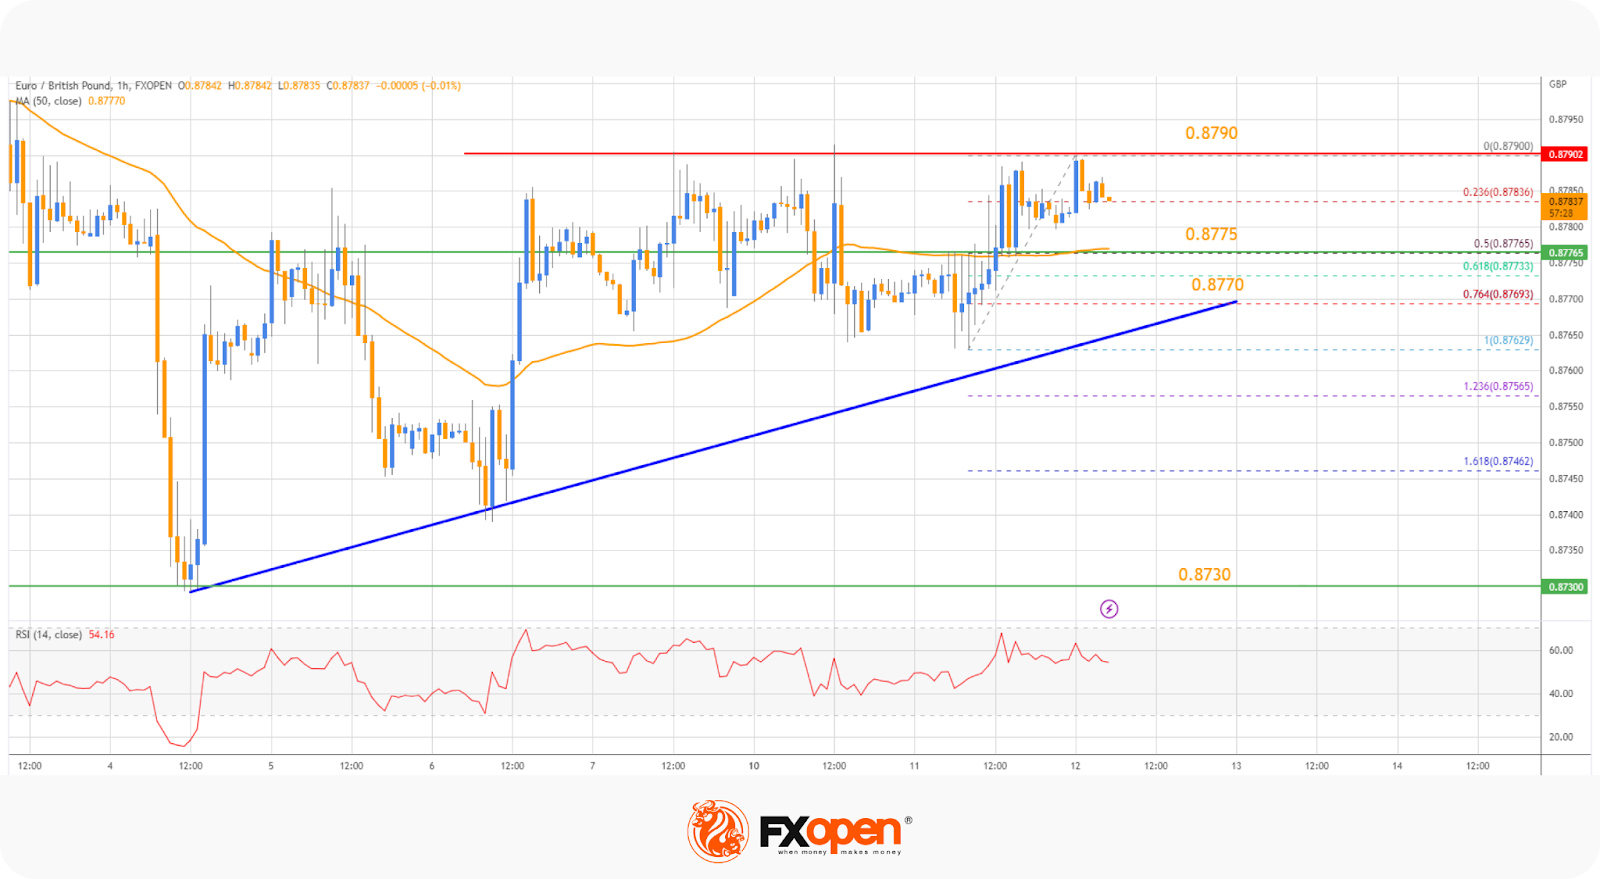
The recent high was formed near 0.8790, and the pair is now consolidating. If there is a bearish reaction and RSI falls below 50, the pair might find bids near the 50-hour simple moving average at 0.8755. The stated support coincides with the 50% Fib retracement level of the upward move from the 0.8762 swing low to the 0.8790 high.
The next major support is near a bullish trendline at 0.8770. A downside break below it may lead to more downward moves. In the stated case, the pair could decline toward the 0.8730 support level in the near term.
Conversely, the bulls could break above the 0.8790 resistance. The next major barrier for the bulls is near 0.8825, above which EUR/GBP could accelerate higher. In the stated case, the bulls may perhaps aim for a test of 0.8880. Any more gains might send the pair toward the 0.8900 level.
This forecast represents FXOpen Companies’ opinion only, it should not be construed as an offer, invitation, or recommendation with respect to FXOpen Companies’ products and services or as financial advice.
Trade over 50 forex markets 24 hours a day with FXOpen. Take advantage of low commissions, deep liquidity, and spreads from 0.0 pips (additional fees may apply). Open your FXOpen account now or learn more about trading forex with FXOpen.
This article represents the opinion of the Companies operating under the FXOpen brand only. It is not to be construed as an offer, solicitation, or recommendation with respect to products and services provided by the Companies operating under the FXOpen brand, nor is it to be considered financial advice.
Stay ahead of the market!
Subscribe now to our mailing list and receive the latest market news and insights delivered directly to your inbox.


Latest articles

Weekly Market Insights with Gary Thomson: The Week of Central Banks and Earnings
In this video, we’ll explore the key economic events and market trends, shaping the financial landscape. Get ready for insights into financial markets to help you navigate the week ahead. Let’s dive in!
In this episode of Market

Intel at a Crossroads: Earnings Beat Meets Technical Resistance
Intel has just delivered its strongest quarter in over fifteen years, and the market reaction says it all. Q2 2026 revenue surged 25% year-over-year to $16.1 billion, crushing the consensus estimate of $14.42 billion, while adjusted EPS of

Tesla: Complex Range Structure Breaks Down Following Quarterly Earnings
Tesla released its Q2 2026 results after the market closed on 22 July. Revenue increased 26% year-on-year to $28.24 billion, while vehicle deliveries reached a record 480,126 units. However, operating margin fell sharply to 1.4%, down from