The Bias for LTC/USD and EOS/USD is Short-term Bullish
LTC/USD
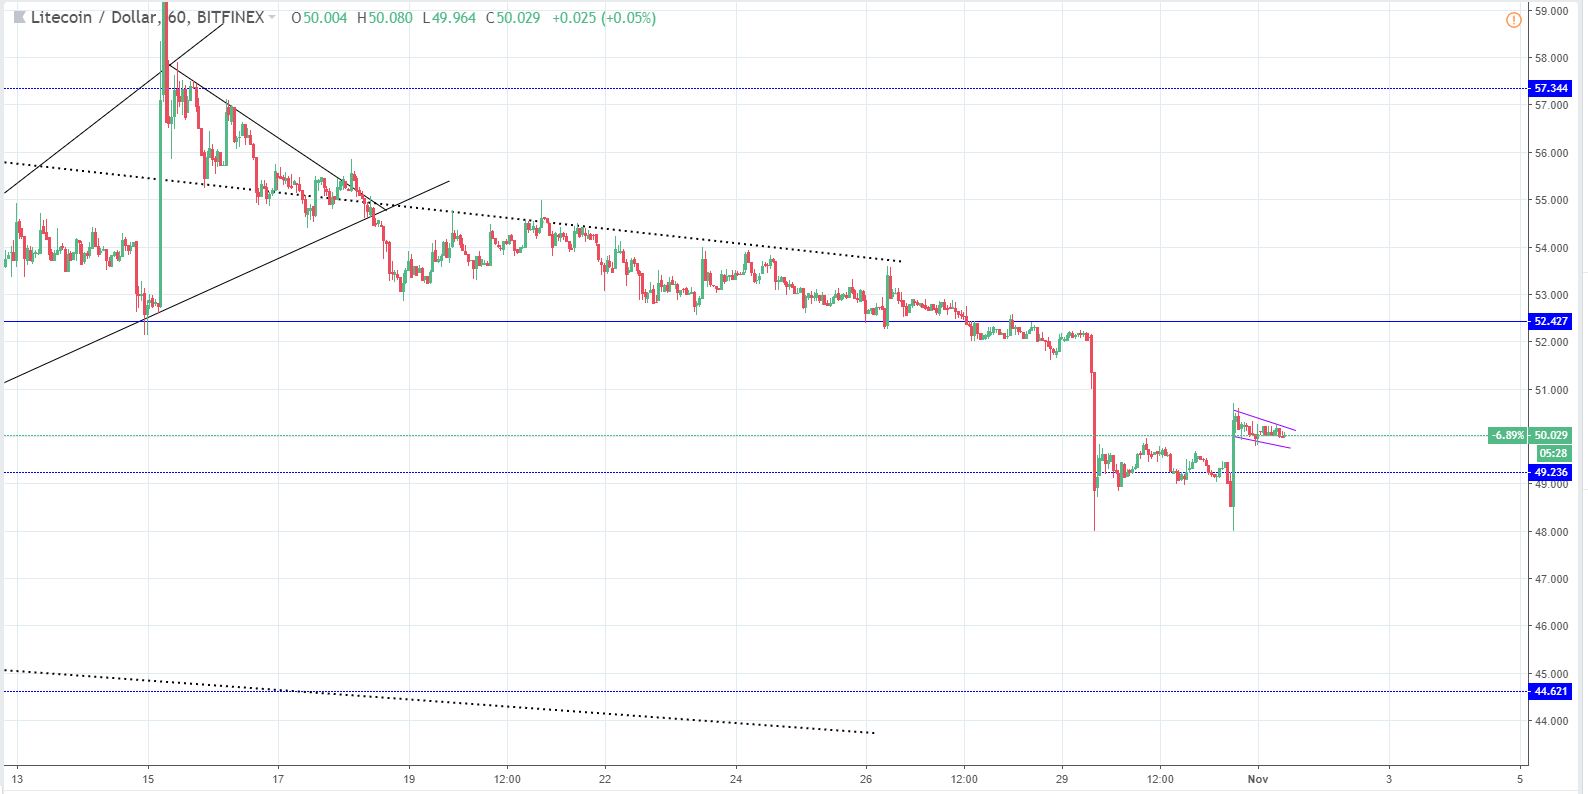
From last Monday high at $53.8 the price of Litecoin has decreased by about 9% at its recent lowest point at $48.87. Currently, the cryptocurrency is traded at $50.029, which almost a 2% recovery from the mentioned low as the price is in an upward trajectory.
On the hourly chart, we can see that the price went below the horizontal support level at $52.4 and a big red candle appeared indicating that selling was activated around that area. As the price dropped, it went below the next horizontal support level at $49.23 dipping two times below it and leaving two wicks that both reach out to $48. Currently, as the price has recovered with a big green candle, we are seeing a minor descending structure that is corrective in nature and will likely result in another increase from these levels.
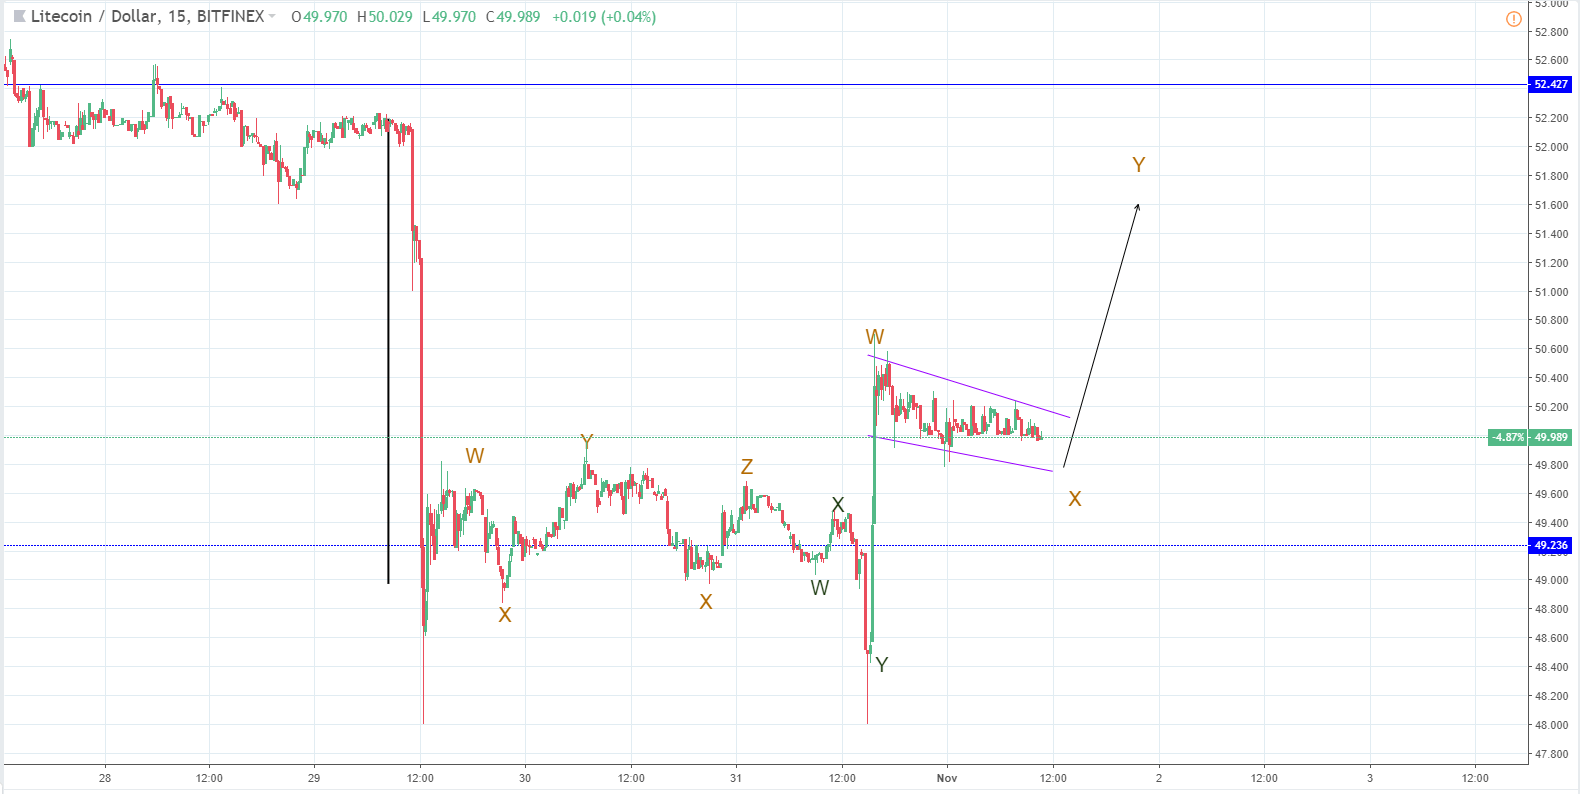
Zooming into the 15 min timeframe I have counted the corrective sub-waves and they confirm the assumption that the price is heading further up from here.
The first correction is a sideways correction – WXYXZ, after which a three-wave correction occurred and the third and the current one is another three-wave correction in the opposite direction. The target for the last Y wave is around the prior range support at $51.59, which correlates with the length of the W wave projected from the assumed X position. The target will vary from the X wave ending point as the correction has more room to end.
This correction will end up as a triple three correction, if it ends as projected, and because the last wave ends on the upside, a trend will continue to the downside. The horizontal support level at $49.23 is the S1 from the support zone range. It makes it a highly significant level. However, as it was weakened I believe that it is going to be broken on the next run down leading the price to the next support level, which is the S2 from the mentioned range at $44.621.
EOS/USD
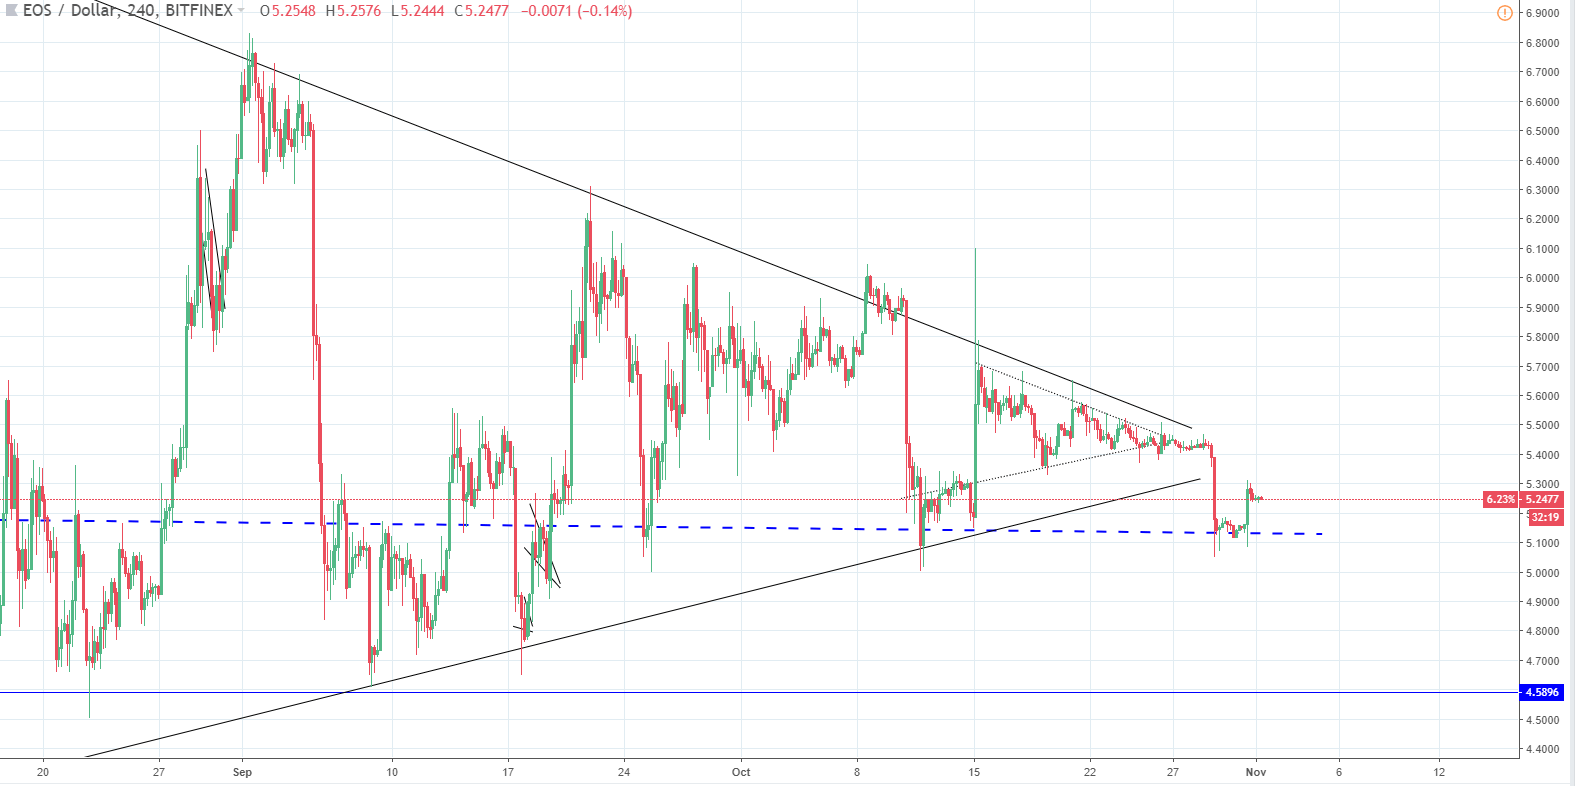
Since last Monday, the price of EOS went from its high at $5.5 to $5.39 steadily but has dropped from there steeply and quickly to $5.05 and found support on the horizontal level at $5.133. It is now above it, trading at $5.247, which is an overall decrease of 4.6%.
Looking at the 4-hour chart you can see the mentioned significant horizontal level from which the price bounced off and recovered slightly reaching $5.3 level. It pulled back to the minor support level where it is retesting the support. If the price does find the support we would be expecting another move to the upside potentially reaching the level from which the price fell steeply around $5.4. Now we can expect more downside below the mentioned horizontal support level market with a blue bold dashed line.
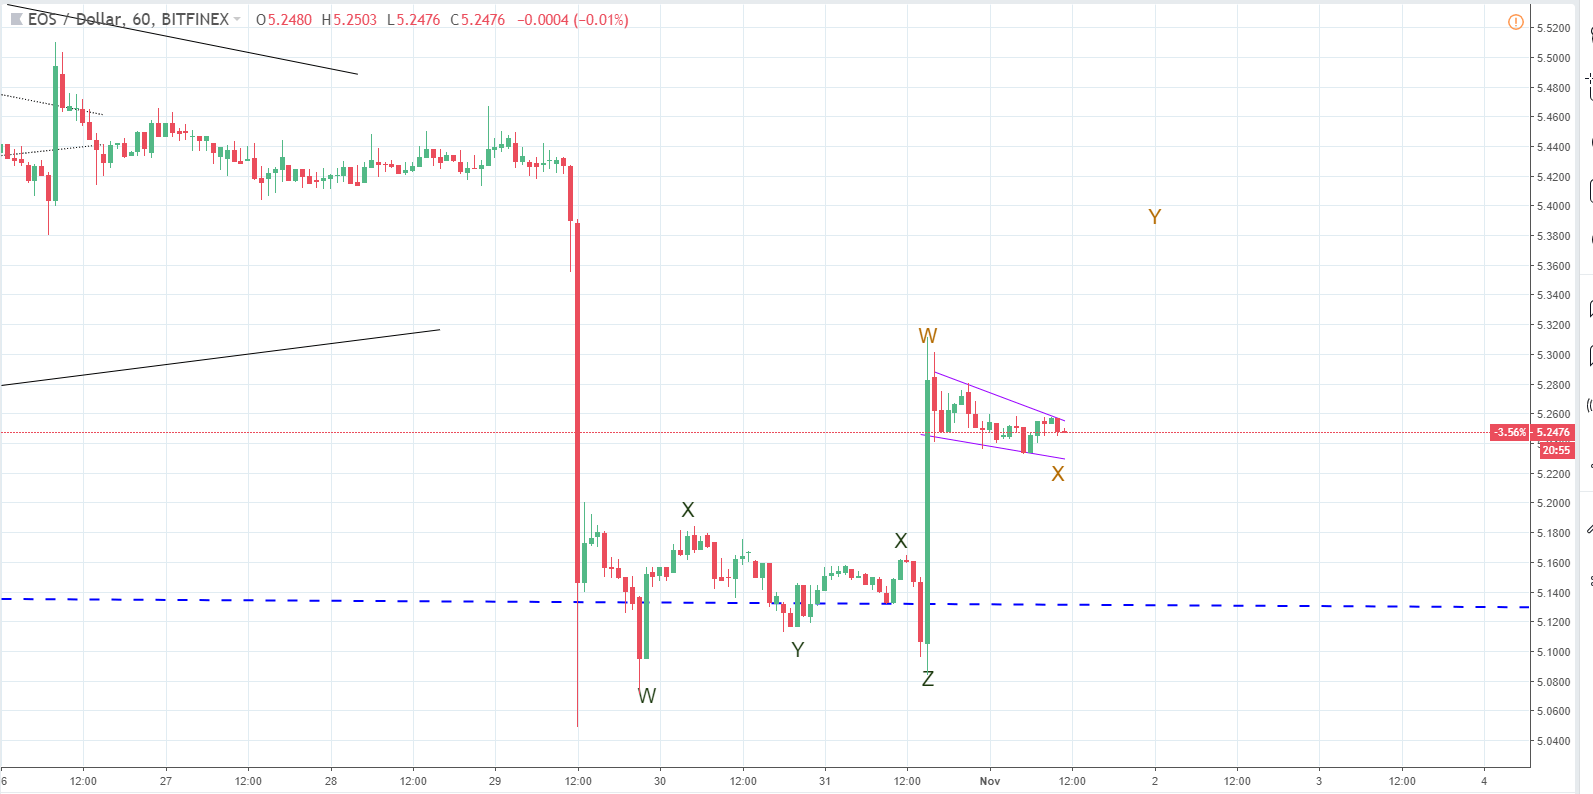
Zooming into the hourly chart we can see a similar situation like in the case of Litecoin.
The price went three times below the significant horizontal level before spiking up and now it is forming a descending structure that is corrective in nature. Unlike in the case of Litecoin here we can see only two corrections, the third one to the downside before spiking up again could be a possibility. The target price would be around $5.4 area, which is the next horizontal significant resistance level.
In either way we may expect the price to go down below the prior low as the wave Y ends on the upside, and a trend continuation should be expected.