USD/CAD Breaks Neckline As Double Bottom Pattern Weighs
USD/CAD faces rejection ahead of the 1.1000 handle after a major bullish reversal earlier this week. The sentiment remains extremely bullish due to Higher Low (HL) in the recent correction phase. Moreover, the double bottom price pattern is also keeping the pair under bullish momentum, eyeing the 1.1050 resistance area.
Technical Analysis
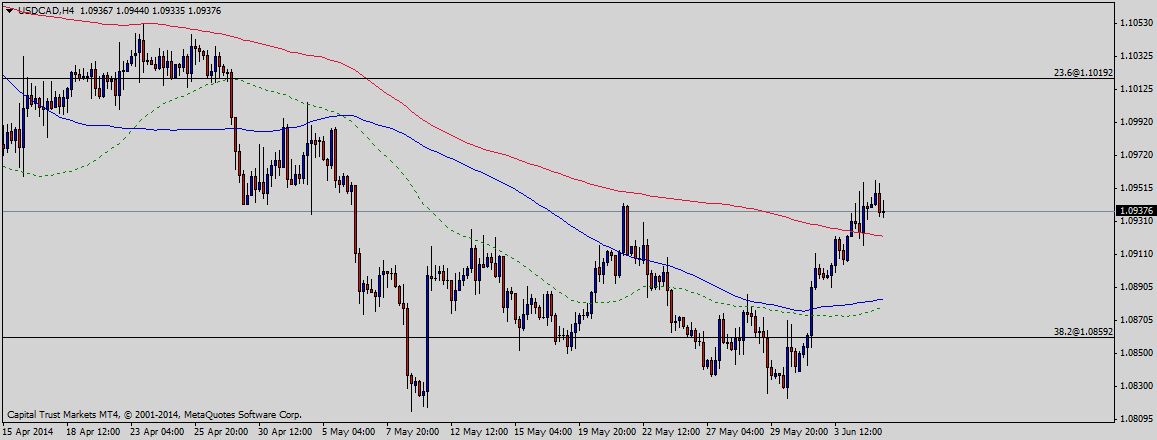
As of this writing, the pair is being traded near 1.0938. A major support can be noted around the current level which is the neckline of the double bottom price pattern. Not to mention, the pair has already broken the neckline which is considered a confirmation signal for the authenticity of the price pattern among traders.
On the upside, the pair is expected to face a hurdle near 1.0956, the high of the ongoing week ahead of 1.1019, the 23.6% fib level and then the 1.1050 resistance area. The sentiment will remain positive as far as the double bottom support area is intact.
Canada Purchasing Managers Index
Richard Ivey School of Business is due to release the Purchasing Managers Index of Canada today. According to the median projection of different economists, the PMI increased to 56.0 points in May as compared to 54.1 points in the month before, better than expected actual outcome will be seen as moderately bearish for USD/CAD and vice versa.
US Jobless Claims
The US labor department will release the initial jobless claims figure for the week ended on 31 May. According to the average forecast, the number of people who claimed jobless incentives during the said time rose to 310K as compared to 300K in the week before, better than expected actual reading will be seen as bullish for the pair and vice versa.
Conclusion
Considering the overall technical and fundamental outlook, buying the pair around the neckline support area appears to be a good strategy with a potential target around the swing high of the last major rally.