


FXOpen
The US Dollar (USD) extended downside movement against the Japanese Yen (JPY) on Friday, dragging the price of USDJPY to less than 113.20 following the release of some key economic data from the United States during yesterday’s New York session.
Technical Analysis
As of this writing, the pair is being traded around 113.07. A support may be noted near 112.70, the intraday low of today ahead of 110.96-111.00 which is the confluence of psychological number as well as swing low of the last major downside movement as shown in our daily chart.
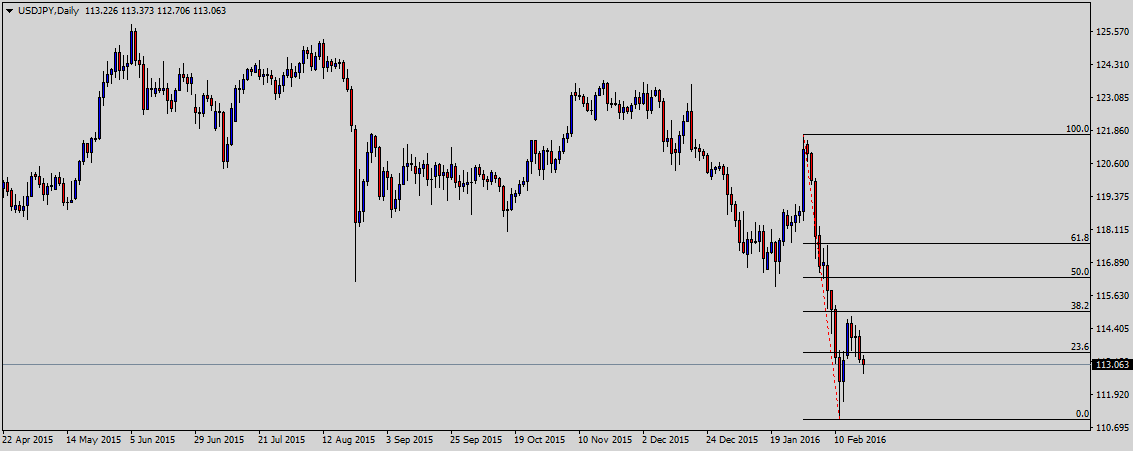
On the upside, the pair is likely to face a hurdle near 113.48, the 23.6% fib level ahead of 114.86, the swing high of the last major upside rally and then 115.00, the psychological number. The technical bias will however remain bearish in the long run as long as the 114.86 resistance area is intact.
US Jobless Claims
The number of Americans filing for unemployment benefits unexpectedly fell last week, pointing to labor market strength that could keep Federal Reserve interest rate hikes on the table this year. A separate report from the Philadelphia Federal Reserve suggested business activity in the U.S. mid-Atlantic region improved slightly, but were still struggling. Initial claims for state unemployment benefits decreased 7,000 to a seasonally adjusted 262,000 for the week ended Feb. 13, the lowest reading since November, the Labor Department said on Thursday. The prior week’s claims were unrevised. Economists polled by Reuters had forecast claims rising to 275,000 in the latest week.
Trade Idea
Considering the overall technical and fundamental outlook, buying the pair around current levels appears to be a good strategy in short to medium term if we get a valid bullish reversal candle on the daily chart.
Trade over 50 forex markets 24 hours a day with FXOpen. Take advantage of low commissions, deep liquidity, and spreads from 0.0 pips (additional fees may apply). Open your FXOpen account now or learn more about trading forex with FXOpen.
This article represents the opinion of the Companies operating under the FXOpen brand only. It is not to be construed as an offer, solicitation, or recommendation with respect to products and services provided by the Companies operating under the FXOpen brand, nor is it to be considered financial advice.
Stay ahead of the market!
Subscribe now to our mailing list and receive the latest market news and insights delivered directly to your inbox.


Latest articles


XAG/USD Analysis: Silver Drops to March Low
As seen on the XAG/USD chart, the price of silver fell to the $70 level and briefly pierced it, marking the lowest level since early February.
Although geopolitical tensions typically support demand for safe-haven assets, silver is under pressure

XBR/USD Analysis: Brent Crude Rises Above $110
Yesterday, Brent crude prices moved sharply higher, with the XBR/USD chart showing breakouts above local resistance levels. Today, the price has climbed above the $110 mark, bringing it close to the multi-year high recorded on 9 March.
The bullish