USD/JPY Threatens Long Term Triangle Formation
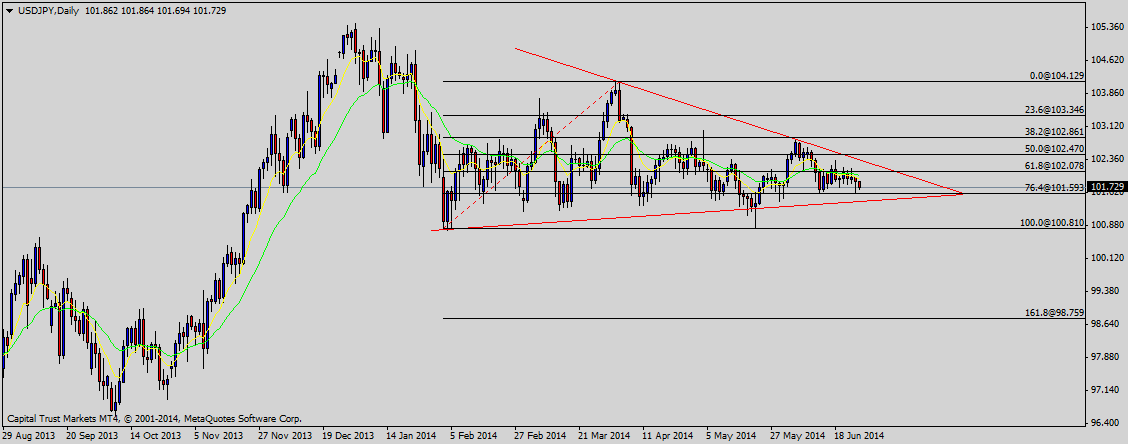
The US Dollar (USD) extended downside movement against the Japanese Yen (JPY) on Thursday, threatening the long term triangle formation on the daily chart. The sentiment remains neutral; a breakout through the triangle will provide clear direction to the pair.
Technical Analysis
As of this writing, USD/JPY pair is being traded near 101.73. A support can be noted around 101.40, the lower trendline channel as demonstrated in the following chart. A break and daily closing below the trendline support could spur a renewed selling pressure, validating a dip towards the 100.00 milestone.
On the upside, the pair is expected to face a hurdle near 102.07, the 61.8% fib level ahead of 102.33, the trendline resistance. A daily closing above the channel resistance will validate fresh rallies above the 103.00 handle.
Japan Inflation
The Ministry of Internal Affairs & Communications will release the Japan’s inflation report tomorrow. According to the median projection of different economists, the inflation remained 2.6% in May as compared to 3.4% in the same month of the year before. Generally speaking, higher inflation is considered positive for the developed economies like Japan, so a worse than expected actual outcome will be seen as bullish for USD/JPY and vice versa.
Unemployment Rate
Japanese government will also release the unemployment rate figure tomorrow. According to the average forecast of various analysts, the rate of unemployment in Japan remained 3.6% in May as compared to the same rate in the month before, better than expected actual outcome will be seen as bearish for USD/JPY and vice versa.
Conclusion
Keeping in view the overall technical and fundamental outlook, buying or selling the pair on a breakout through the daily triangle formation appears to be a good strategy in the long run, the trade should however be stopped out on a daily closing back inside the triangle as described above.