


FXOpen
The Hook reversal pattern is a compelling tool in technical analysis that traders employ to trade various financial instruments. You can spot the Hook pattern in stocks, currencies, and commodities. This article delves into the intricacies of this formation, shedding light on its definition and how to spot it and develop an effective trading strategy.
What Is a Hook Pattern?
The Hook pattern in technical analysis is a candlestick formation characterised by a unique hook-like structure. It reflects a potential shift in market sentiment, signalling the end of a prevailing trend. There are bullish and bearish Hook patterns.
- First Candlestick: The first candlestick aligns with the prevailing trend, which means it can be a bullish (upward) or bearish (downward) candlestick, depending on the current trend direction. This candlestick often has a relatively large real body.
- Second Candlestick: The second candlestick is the opposite of the first one in terms of trend direction. The key characteristic of the Hook Reversal is that the second candlestick's open and close are both contained within the range of the first candlestick, resembling a "hook."
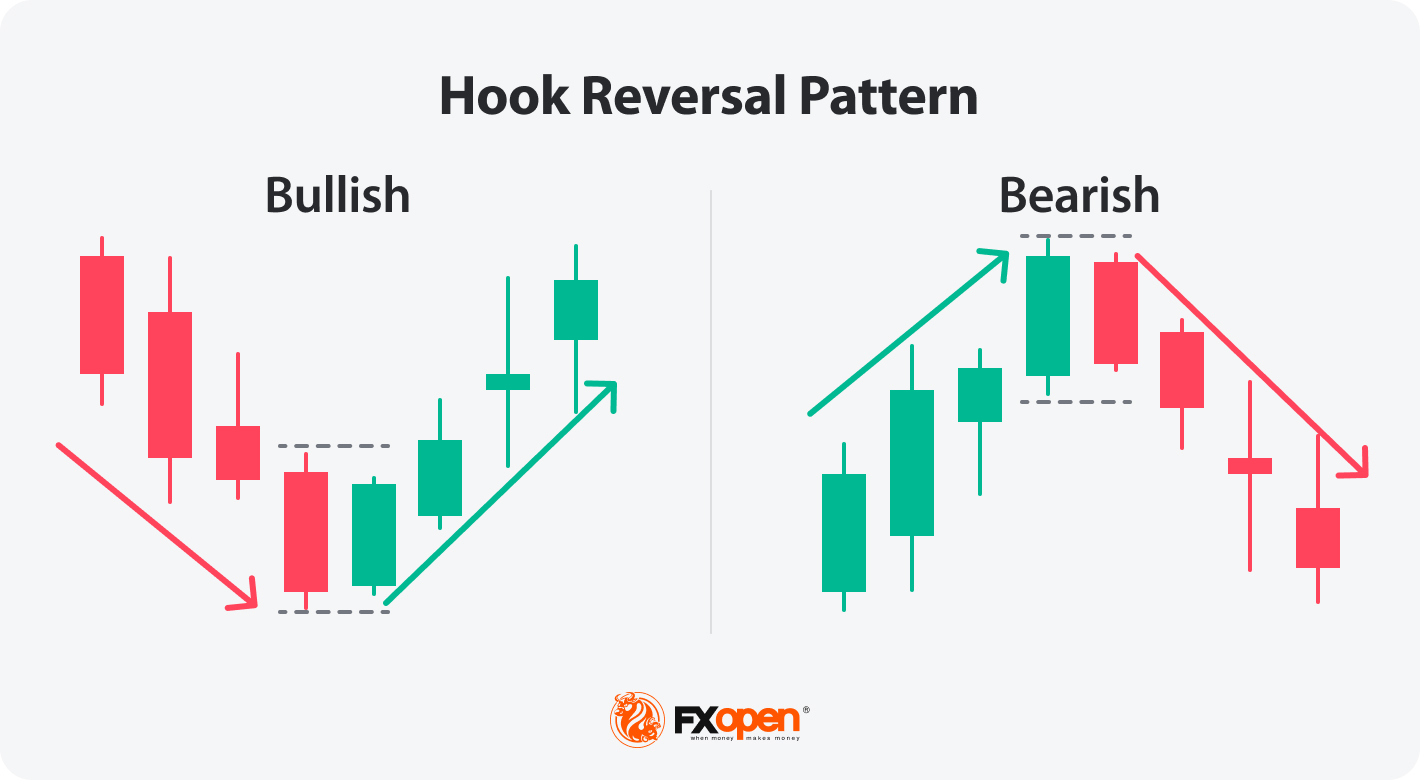
The key feature of this pattern is that candlesticks don’t differ in size significantly.
How to Trade the Hook Pattern
As the Hook pattern is an indicator of a trend reversal, you may consider the following strategy:
- Entry: For a bullish reversal, consider placing a buy-stop order above the high of the Hook Reversal. Conversely, for a bearish reversal, you may initiate a sell-stop order below the pattern's low.
- Take Profit: Determining a precise profit target can be challenging, but traders often look to set it at the nearest strong resistance level for bullish trades and solid support levels for bearish trades.
- Stop Loss: You may implement a stop-loss order above the setup in a short trade and below it in a long trade to mitigate potential losses if it moves unfavourably.
Live Market Example
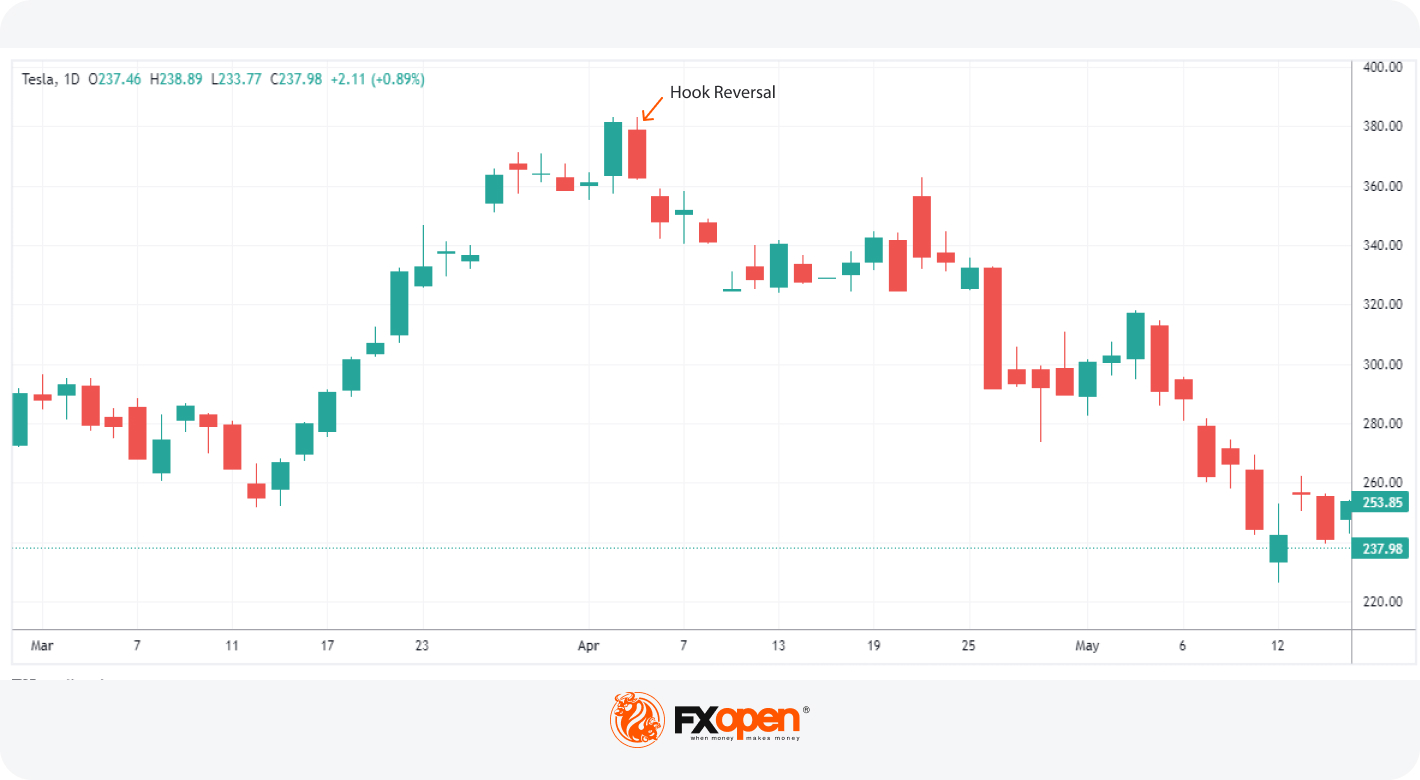
Below you can find the Tesla chart on the TickTrader platform by FXOpen, where the setup is observed. A trader could place a sell-stop order below the low of the pattern, take profit at a nearby support level, and set a stop loss above the setup in accordance with the risk-reward ratio.
How to Confirm the Hook Reversal Pattern
To confirm signals of the Hook Reversal, traders may consider the following:
- Volume Confirmation: Look for increased trading volume after the pattern is formed to validate the reversal signal's strength.
- Support/Resistance Levels: Check if the pattern occurs near significant support or resistance levels, adding credibility to the signal.
- Additional Indicators: Use complementary technical indicators, such as moving averages or oscillators, to confirm the reversal.
- Follow-Through: Wait for subsequent price action to confirm the pattern's signal, seeking confirmation through the direction of the next few candles.
These confirmation techniques may help reduce the risk of false signals.
Final Thoughts
Understanding the Hook Reversal pattern's characteristics and employing appropriate entry, take-profit, and stop-loss points may empower traders to make informed decisions. However, as with any trading strategy, it is crucial to complement it with other analysis methods and employ sound risk management practices. If you want to test strategies with this pattern, you can open an FXOpen account to trade it on various markets with tight spreads and low commissions.
FAQs
Can the Hook Reversal Be Applied to Various Financial Instruments?
Yes, it is a versatile tool, so you can employ the Hook pattern in stock, forex, and commodity trading.
How Often Does the Hook Reversal Occur in Charts?
The frequency of the formation depends on market conditions, but it tends to appear during potential trend reversals. Regular chart analysis on a day-to-day basis can help determine the frequency.
Are There Specific Timeframes Where the Hook Reversal Is More Prevalent?
The pattern can appear across various timeframes. However, traders commonly observe it on short-term charts for intraday trading.
What Factors Should I Consider When Determining a Profit Target for Hook Reversal Trades?
While determining a precise target can be challenging, you may consider looking for the nearest strong resistance level for bullish trades and solid support levels for bearish trades.
Are There Any Specific Risk Management Strategies When Trading the Setup?
Yes, the most common approaches are to implement a stop-loss order above/below the setup depending on the market direction to potentially mitigate losses in case the trade moves unfavourably and adjust position sizes according to your risk tolerance.
How Can I Learn to Identify the Formation More Effectively?
You may increase your proficiency through practice and education. Engage in regular chart analysis, study historical charts, and consider educational resources to deepen your understanding.
This article represents the opinion of the Companies operating under the FXOpen brand only. It is not to be construed as an offer, solicitation, or recommendation with respect to products and services provided by the Companies operating under the FXOpen brand, nor is it to be considered financial advice.
Stay ahead of the market!
Subscribe now to our mailing list and receive the latest market news and insights delivered directly to your inbox.


Latest articles


Market Insights with Gary Thomson: Oil, US Retail Sales & NFP in Focus
In this video, we’ll explore the key economic events and market trends, shaping the financial landscape. Get ready for insights into financial markets to help you navigate the week ahead. Let’s dive in!
In this episode of Market

Geopolitics Fuels Volatility: AUD/USD and USD/CAD Near Key Levels
Commodity-linked currencies continue to weaken amid rising geopolitical tensions, which are boosting demand for safe-haven assets and increasing volatility across both FX and commodity markets. The US dollar is gaining support from demand for liquid and defensive assets, while currencies