


FXOpen
In the fast-paced world of trading, the Kicker pattern stands out as a powerful signal traders use to trade various instruments. This article delves into the intricacies of the formation in the financial markets, elucidating its definition, how to identify it, and how to develop an effective trading strategy, particularly focusing on its meaning and significance in the context of market analysis.
What Is a Kicker Pattern?
The Kicker is a technical analysis pattern reflecting a sudden and decisive reversal in the prevailing trend. It signifies a rapid shift in market sentiment, providing traders with valuable insights into a potential trend change.
As it is a reversal pattern, it may be more reliable in strongly trending markets where a reversal is likely and may be less effective in sideways or ranging markets where clear trends are absent. Traders should exercise caution and seek additional confirmation in such market conditions.
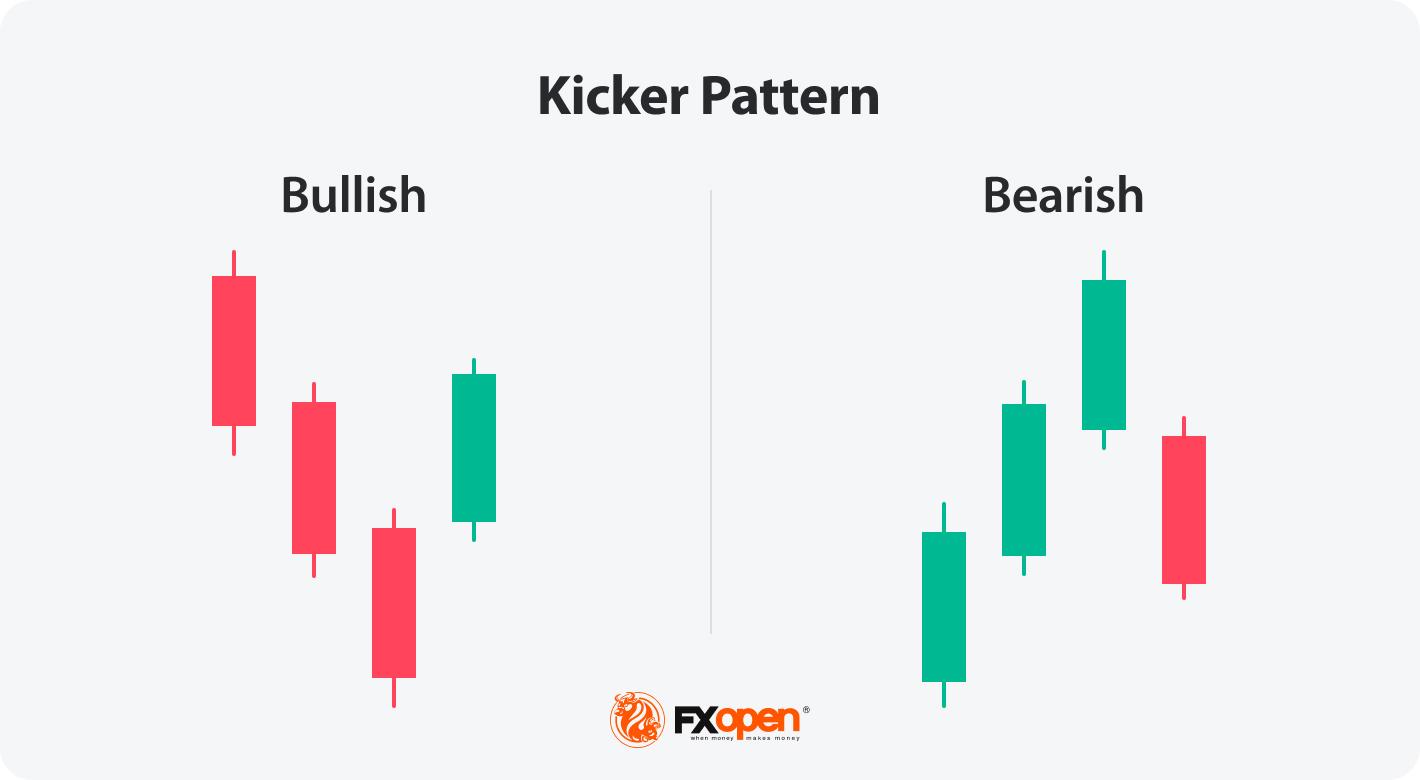
When identifying the Kicker candlestick pattern, traders conduct a meticulous examination of the price chart, with a focus on specific criteria. In the case of the bullish Kicker candlestick pattern, it unfolds with the emergence of two consecutive candlesticks, each displaying bodies of opposite colours. Crucially, the initial candle aligns with the prevailing downtrend. The second candlestick, indicative of a robust bullish sentiment, opens with a conspicuous gap up. This pronounced gap serves as a clear signal of a rapid and decisive shift in market sentiment, transitioning from the preceding bearish phase to a bullish reversal.
The bearish Kicker shares a similar structure. It initiates with two consecutive candlesticks featuring bodies of opposite colours, and the first candle aligns with the existing uptrend. However, in this scenario, the second candlestick opens with a distinct gap down, marking a sudden and significant change from the preceding bullish sentiment to a bearish reversal.
These distinctive features of consecutive opposite-coloured bodies and gap openings are key markers for traders to identify and interpret the Kicker candlestick pattern, enabling them to potentially make informed decisions in response to shifting market dynamics.
The frequency of this setup's occurrence is influenced by market volatility. In periods of heightened volatility, traders may observe it more frequently as it reacts to sudden market shifts. Regular chart analysis is essential for traders to identify potential occurrences of this formation.
How to Trade the Setup
Trading the Kicker involves a strategic approach. It should include a proper entry with a good risk-reward ratio. Here is how you may take an entry:
- For a bullish/bearish trade, you may initiate a buy/sell position at the close of the second candlestick.
- You may set a profit target based at key support/resistance levels.
- Traders may implement a stop-loss order to manage potential losses. Consider placing it below the low (for bullish) or above the high (for bearish) of the setup.
When traders trade Kicker, meaning open buy and sell positions based on the setup’s indications, they often look for confirming signals to potentially enhance the reliability of their decisions. For example, an increase in trading volume on the second candle, along with supporting momentum indicators, may strengthen the case for a reversal.
Live Market Example
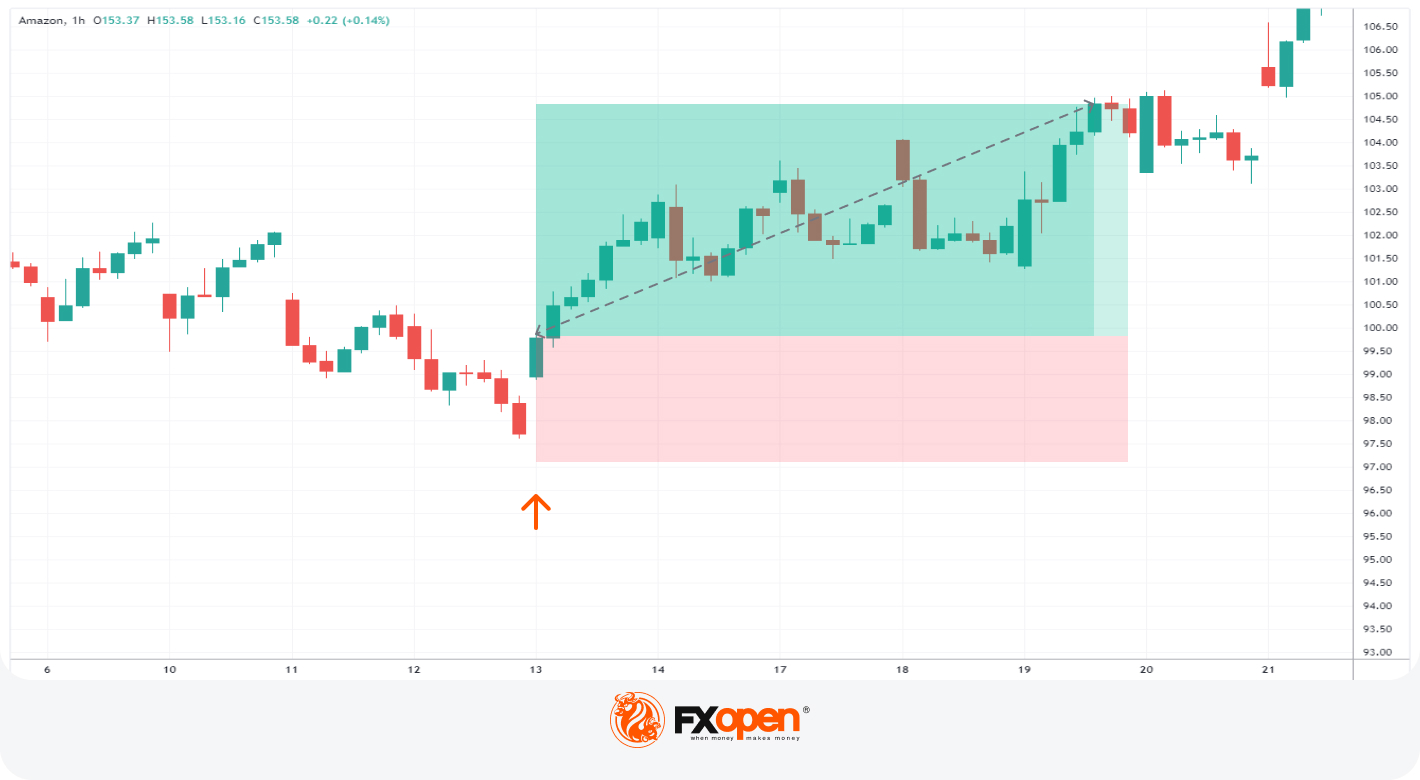
Let's explore a live market example on an Amazon stock chart on the TickTrader platform by FXOpen. The trader enters a buy position at the close of the second candle of the bullish Kicker candlestick. Their take profit is at the next resistance with the stop loss below the kicking bull pattern.
Takeaway
Mastering the Kicker pattern equips traders with a potent tool for identifying rapid trend reversals. By developing strategies with accurate entry, take-profit, and stop-loss points, traders may navigate the markets with confidence. However, it's essential to complement this strategy with other analysis methods and employ sound risk management practices for potentially effective performance. As you master this setup, you may choose to trade it on various instruments by opening an FXOpen account.
FAQs
Can the Kicker Formation Be Used for Short- and Long-term Trading Strategies?
The setup is versatile but is usually applied to short-term trading strategies. Its effectiveness may vary based on the timeframe and market conditions. Traders need to adjust their approaches and consider the broader market context when incorporating the formation into their chosen strategies, ensuring alignment with their trading goals.
Can the Kicker Pattern Be Part of an Automated Trading Strategy?
Yes, the formation is adaptable, allowing traders to incorporate it into algorithmic strategies. Automated systems can recognise and respond to Kicker based on predefined rules. Traders implementing automated strategies should ensure a robust system for pattern recognition and risk management to potentially enhance its reliability.
Can the Kicker Setup Be Used to Identify Breakout Opportunities?
Yes, the Kicker's ability to signal rapid reversals can also be applied to identify potential breakout points, especially when combined with support and resistance levels. If you trade the bullish Kicker, you may consider opening a trade after a resistance breakout. In the case of the bearish Kicker, traders look for a breakout of a support level.
This article represents the opinion of the Companies operating under the FXOpen brand only. It is not to be construed as an offer, solicitation, or recommendation with respect to products and services provided by the Companies operating under the FXOpen brand, nor is it to be considered financial advice.
Stay ahead of the market!
Subscribe now to our mailing list and receive the latest market news and insights delivered directly to your inbox.


Latest articles


Market Insights with Gary Thomson: Oil, US Retail Sales & NFP in Focus
In this video, we’ll explore the key economic events and market trends, shaping the financial landscape. Get ready for insights into financial markets to help you navigate the week ahead. Let’s dive in!
In this episode of Market

Geopolitics Fuels Volatility: AUD/USD and USD/CAD Near Key Levels
Commodity-linked currencies continue to weaken amid rising geopolitical tensions, which are boosting demand for safe-haven assets and increasing volatility across both FX and commodity markets. The US dollar is gaining support from demand for liquid and defensive assets, while currencies