


FXOpen

Stock prices change every second, so it may seem like there is no specific reason for their movements. However, every change has a reason. Understanding the factors affecting stock prices gives context. Long-term and short-term factors determine how the price moves in different timeframes. News, company reports, and broader economic and geopolitical shifts — all influence price fluctuations in different ways.
In this article, we'll discuss what causes stocks to go up and down and why markets react the way they do.
What Causes Stocks to Go Up and Down? Key Takeaways
- Stock prices change because supply and demand shift. When buying pressure outweighs selling, prices rise, and the opposite happens when sellers dominate.
- Short-term price movement often reacts to headlines and sentiment, while long-term movement usually reflects fundamentals and broader economic trends.
- Core factors that affect stock prices include economic data, corporate earnings, market sentiment, monetary policy, and global stability.
- Structure, risk awareness, and avoiding emotional decisions can support more consistent navigation of market movement.
What Makes the Stock Market Go Up and Down in the Short-Term vs Long-Term?
Stock prices move for different reasons depending on the timeframe. Short-term price changes tend to react to news, rumours, order flow, and fast shifts in sentiment. A single headline can cause a sharp move, even if nothing about the company’s long-term outlook has changed.
A downgrade from a major bank or an unexpected earnings miss often triggers an immediate reaction as traders adjust exposure — according to a 2024 analysis by the Coppo Report, companies that miss earnings expectations see their stock drop on average 6.3% on reporting day. High-frequency traders and algorithms also contribute to short bursts of volatility by reacting to data faster than humans.
But the same stock can trade higher over long periods as global companies consistently expand, generate revenue, and reinvest in growth. This explains why some people ask, “why does the stock market keep going up?”
For example, Amazon and Microsoft spent decades scaling operations, and their share prices reflected that growth over time. Wider economic forces also influence longer trends. Interest rate cycles, inflation trends, and long-term expectations for growth shape how investors value equities over months or years rather than minutes.
Short-term noise is influenced by many small factors, but long-term trends usually align with fundamentals and economic direction. Understanding the difference stops short-lived volatility from distracting from the bigger picture.
Why Do Stocks Go Up and Down? Supply and Demand
Stock prices move because people are buying and selling, and the balance between the two shifts constantly. This process sounds simple, but there’s real structure behind it.
Buyer and Seller Imbalance
When more buyers want shares than sellers are willing to offer, the price rises. Buyers compete for limited supply, so they accept higher prices to secure shares. The opposite happens when selling pressure dominates. For example, during earnings disappointments, sellers often rush to exit, creating sharp downward moves as buyers demand discounts.
This imbalance plays out every second the market is open. No fixed price exists. There’s only the price someone agrees to pay right now.
Market Liquidity
Liquidity refers to how quickly and efficiently shares trade. Highly traded stocks like Apple or Microsoft tend to move in smaller increments because there are many orders on both sides. Meanwhile, research shows stocks with lower liquidity tend to experience greater price swings, because thin order books make prices more sensitive to trades and reduce the capacity of markets to absorb orders without large moves (Drechsler, Moreira & Savov 2020).
Price Discovery Process
Markets constantly update the “fair value” based on new information. Every trade adjusts expectations. Algorithms, institutional investors, and retail traders are all trying to understand how to predict if a stock will go up or down (or more accurately, what factors may influence future movement), and order flow reflects their sentiment. The constant negotiation between buyers and sellers creates the price chart that traders see.
Company-Specific Factors
Stock prices don’t move only because of the wider economy. Company-level developments often drive meaningful shifts in valuation. Some events move the price slowly over time, while others trigger sharp reactions within seconds.
Corporate Earnings and Guidance
Earnings reports sit at the centre of company valuation. Traders watch revenue growth, margins, and net income, but guidance often matters more. A company can post strong numbers and still fall if management signals slower growth ahead. For example, Tesla has seen sharp reactions in the past when production outlook or delivery expectations changed, even if headline earnings were solid. Markets price the future, not the past.
News and Events
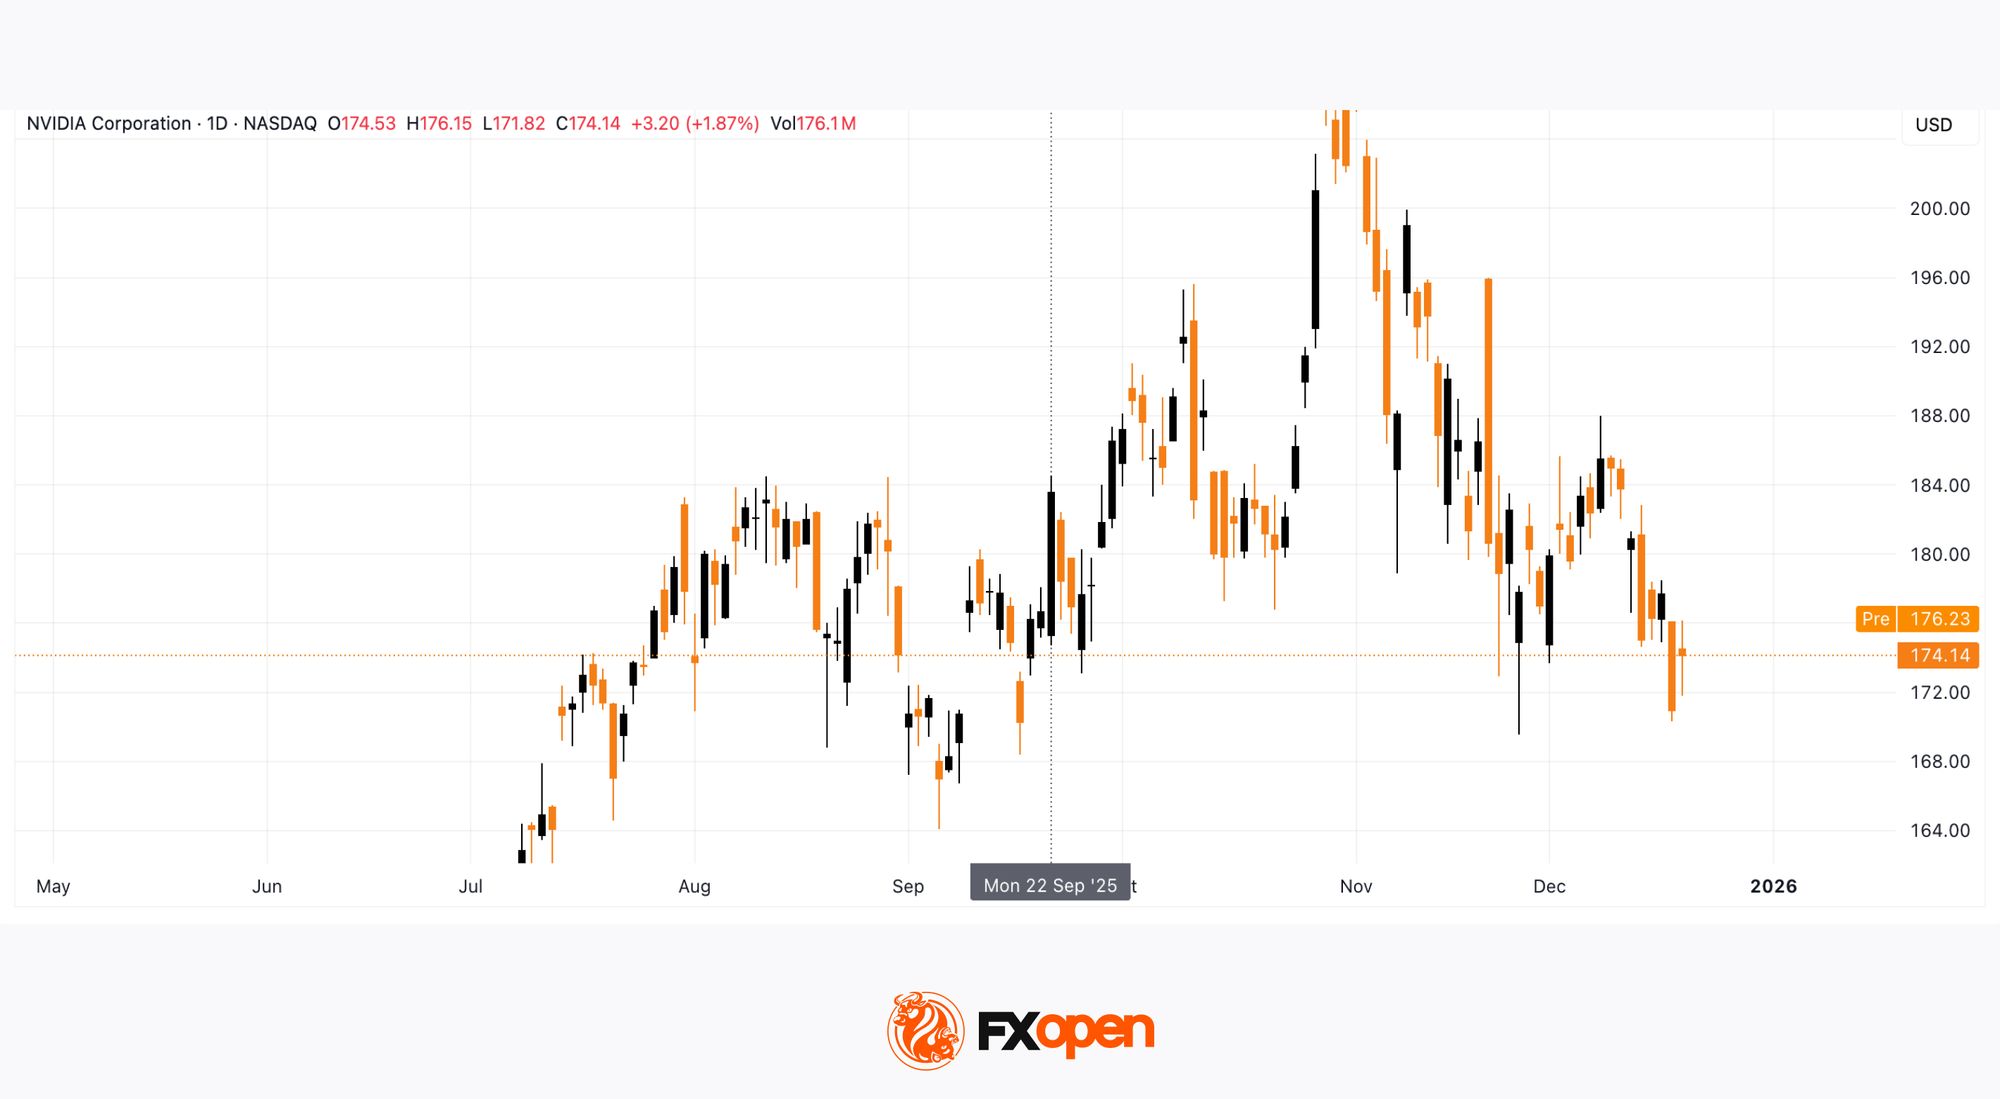
Announcements about product launches, regulatory actions, fraud allegations, or leadership changes often move prices quickly. Apple unveiling a new hardware line or Nvidia announcing AI partnerships (Open AI and Nvidia announced a strategic partnership on September 22, 2025) usually increases investor optimism. On the other hand, unexpected CEO resignations or lawsuits often cause uncomfortable volatility.
Share Actions
Buybacks typically lift prices because they reduce the number of available shares, increasing ownership value for remaining holders. Simultaneously, studies show companies often repurchase shares when they believe stock is undervalued, and such buyback announcements correlate with meaningful increases in share value (Harvard Law School Forum 2025).
Stock splits don’t change the company’s valuation but often attract more retail interest because the share price appears cheaper. Both events shape supply dynamics and sentiment.
Dividends
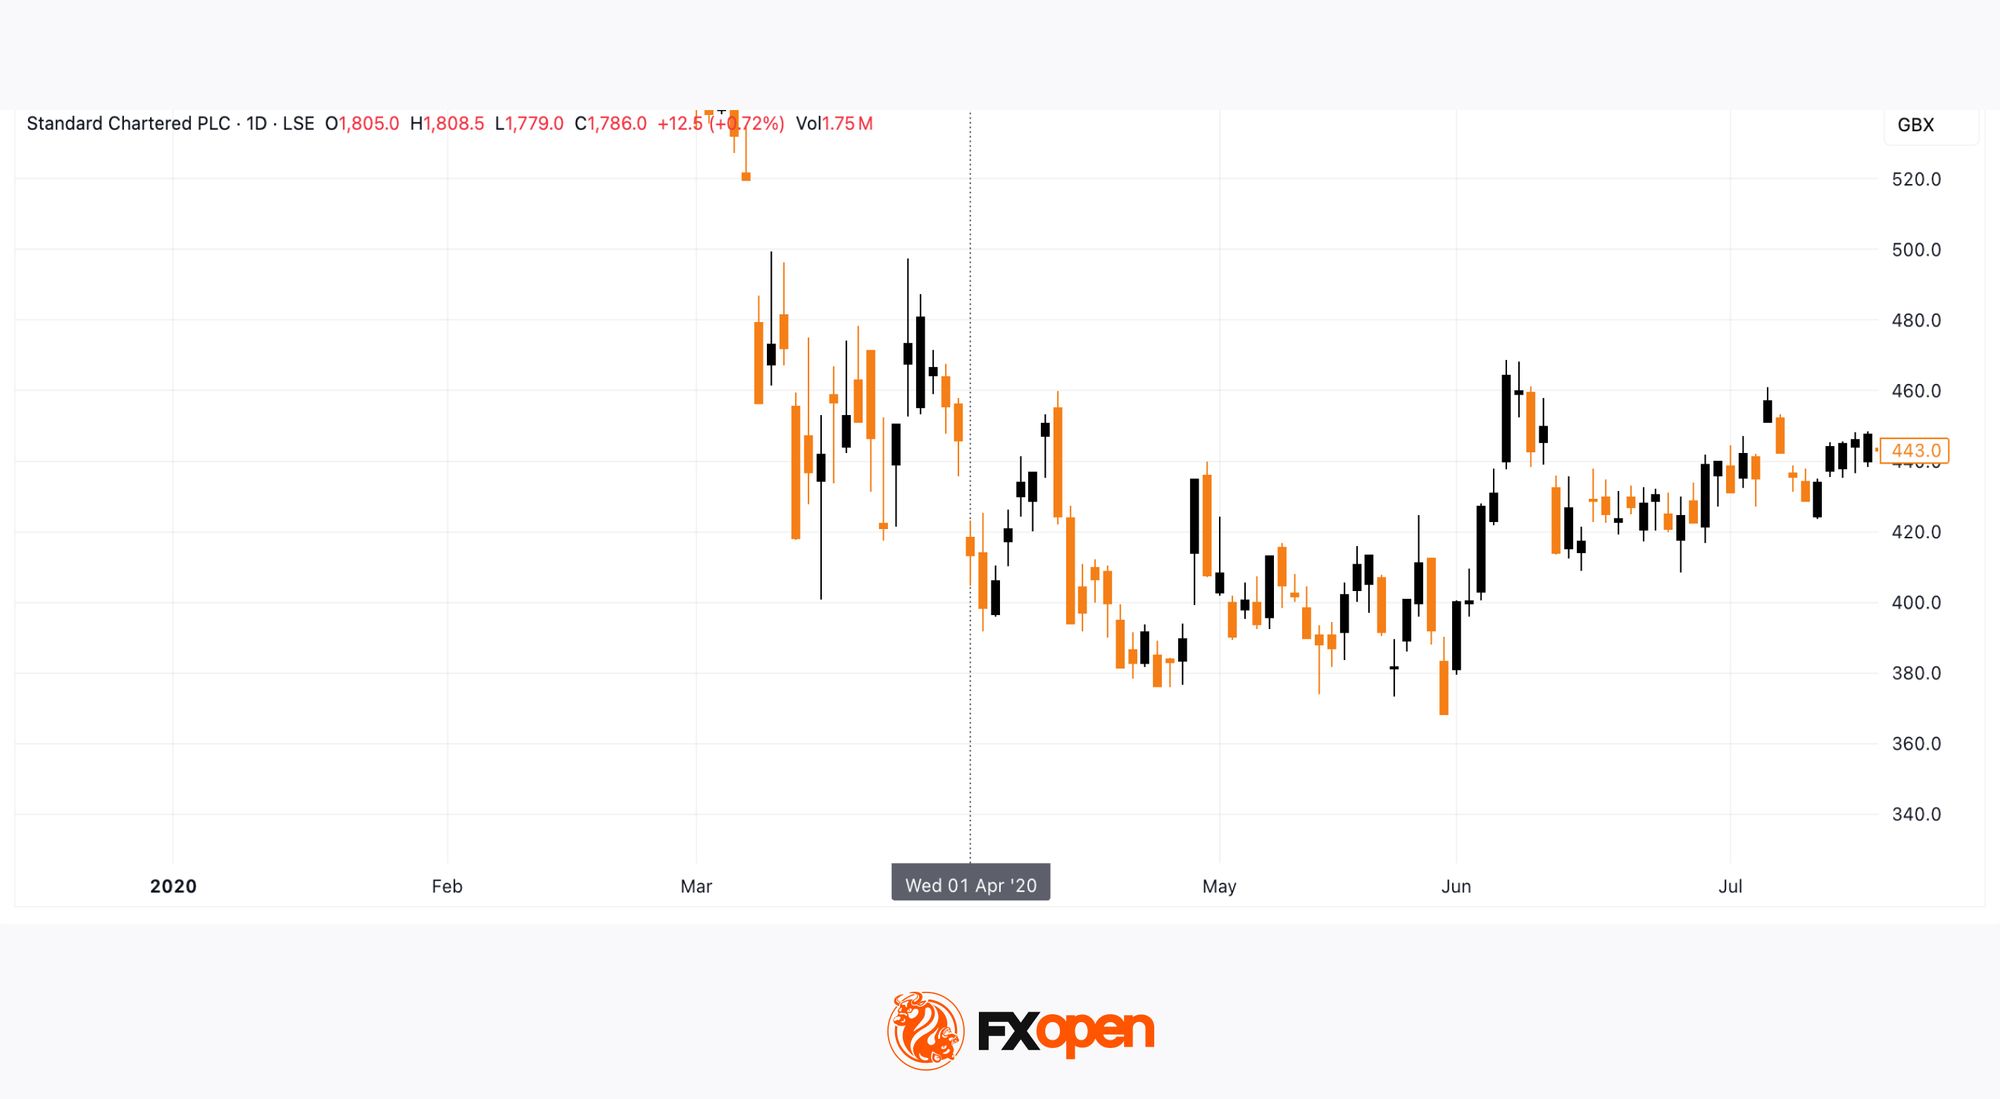
Dividend decisions also influence pricing. A company raising dividends signals financial strength and ongoing cashflow. Cuts signal stress. UK banks saw shares fall across 2020 when dividend restrictions were introduced, as the market viewed it as a sign of uncertainty.
You can explore hundreds of world-famous company stock CFDs in FXOpen's TickTrader platform.
Economic & Market Factors Affecting Stock Prices
Beyond individual companies, wider economic conditions influence how equity markets move. These forces affect investor expectations about growth, spending, and borrowing. Prices reflect these shifting expectations.
Economic Data
Markets react to data releases because they offer clues about earnings and consumer activity. Strong GDP growth, rising retail sales, and low unemployment suggest businesses may generate higher revenue, so equities tend to rise. Weak data does the opposite.
For example, during the 2020 lockdowns, jobless claims in the US surged to record levels, triggering heavy selling across global markets as traders analysed the pressure on corporate cashflow and demand.
Monetary Policy and Interest Rates
Central banks play a major role in market direction. Lower interest rates usually support equities because borrowing becomes cheaper. Companies refinance debt, expand operations, and investors often shift money from bonds toward equities seeking higher returns. Rate hikes create the opposite effect. Higher borrowing costs reduce spending and pressure valuations, especially in sectors relying on growth expectations like technology.
Market Sentiment and Confidence
Emotions influence markets more than people admit. Fear, uncertainty, or overexcitement can move prices faster than fundamentals. Indicators such as the VIX show when traders expect volatility. During uncertainty, equities often become more reactive and sensitive to headlines.
Global Stability and News
International events matter because modern markets are connected. Wars, pandemics, elections, trade tensions, and major policy announcements often trigger broad movement. The post-Brexit referendum session saw the FTSE, pound, and European equities react sharply as markets processed the long-term implications.
How Investors Can Navigate the Stock Market
No one controls market movement, but how one responds to it matters. Having structure lowers stress and keeps decisions grounded in logic rather than reacting to every price spike.
Diversification
Putting money across different sectors and asset classes reduces reliance on one company or industry. A balanced portfolio spreads exposure across areas that behave differently during changing economic conditions.
Risk Management
Having clear limits on single stock or trade exposure potentially balances a portfolio during volatile periods. Some investors set maximum loss levels per trade or per week and review them regularly. The goal is consistency rather than chasing every move.
Staying Informed Without Becoming Reactive
Following earnings, interest rate updates, and company news gives context to price movements. The idea is to understand why something moved, not react to every headline. Market noise fades quickly. Trends backed by solid information last longer.
Avoiding Emotional Trading
Fear and excitement create rushed decisions. It is common to see traders buy at the top because the move feels convincing or sell during volatility because the drop feels permanent. Having a plan before entering the market reduces impulsive reactions.
What Drives Stock Prices? The Bottom Line
Stock prices move for many reasons, and no single factor explains every rise or drop. News, earnings, interest rates, sentiment, and liquidity all play a role, and understanding these influences gives traders context.
Markets react quickly in the short term, but long-term movement usually follows fundamentals and broader economic direction. A structured approach may help traders stay grounded instead of reacting emotionally. If you're interested in exploring a world of hundreds of stock CFDs, you can consider opening an FXOpen account to start analysing live conditions.
FAQs
Why Do Stocks Go Up and Down?
Stocks move because buying and selling pressure changes. Factors such as earnings reports, interest rates, market sentiment, and economic data shift expectations about value, which causes prices to rise or fall.
What Is the 7% Rule in Stocks?
The 7% rule refers to selling a stock once it falls 7% below the purchase price. It aims to potentially limit losses and keep individual positions from damaging overall performance. Please note that no rules guarantee positive results.
What Is the 90% Rule in Stocks?
The 90% rule refers to days when around 90% of market volume is buying or selling. It signals strong market conviction and often appears during sharp rallies or heavy downturns. Another version of the 90% rule refers to the idea that roughly 90% of beginners lose 90% of their trading capital within their first 90 days. It highlights the consequences of poor risk management, emotional decision-making, and strategy hopping.
What Is the 3-5-7 Rule in Day Trading?
The 3-5-7 rule in day trading is a risk management method that states that traders should risk no more than 3% of their total capital on a single trade, keep the combined risk across all open positions under 5%, and aim for potential profits that are at least 7% larger than potential losses to protect capital. Please note that no rules guarantee positive results.
What Is the 10 AM Rule in Stocks?
The 10 am rule refers to waiting until around 10 am US market time before acting. Early volatility often settles by then, giving clearer direction after the opening rush of orders.
This article represents the opinion of the Companies operating under the FXOpen brand only. It is not to be construed as an offer, solicitation, or recommendation with respect to products and services provided by the Companies operating under the FXOpen brand, nor is it to be considered financial advice.
Stay ahead of the market!
Subscribe now to our mailing list and receive the latest market news and insights delivered directly to your inbox.


Latest articles

European Currencies Decline: Pound Hits New Lows, Euro Under Pressure
European currencies continue to weaken against the US dollar amid rising geopolitical tensions and increased demand for safe-haven and liquid assets. Market participants are reducing exposure to riskier instruments, putting pressure on both the euro and the pound. Additional support

Market Analysis: GBP/USD Dips Further As EUR/GBP Regains Traction
GBP/USD failed to climb above 1.3500 and corrected some gains. EUR/GBP started a decent increase and might aim for more gains above 0.8700.
Important Takeaways for GBP/USD and EUR/GBP Analysis Today
· The British Pound
