


4 of the Best Day Trading Strategies
FXOpen

Day trading is one of the most challenging approaches as it requires traders to make decisions quickly. Therefore, many traders like using established trading strategies. Explore the intricacies of day trading strategies in this article. For those keen on hands-on experience, consider using FXOpen's free TickTrader platform to follow along and enhance your trading insights.
1. Bollinger Bands & RSI Strategy
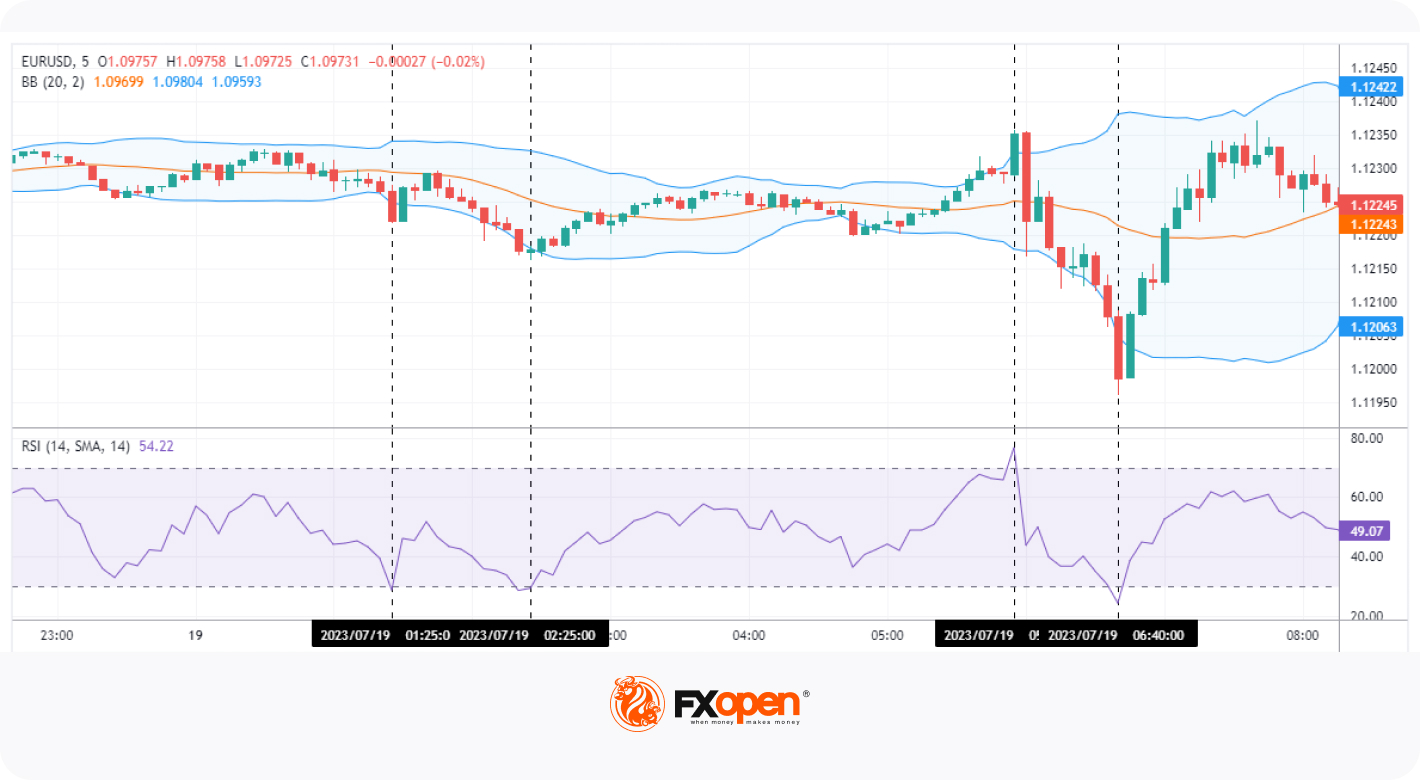
Bollinger Bands and the Relative Strength Index (RSI) are potent tools that, when combined, can offer one of the best strategies for day trading, capitalising on both volatility and momentum.
Entry/Exit Criteria
Entries
Buy Entry:
- Price touches or exceeds the lower Bollinger Band.
- RSI dips below 30 (indicating oversold conditions).
Sell Entry:
- Price touches or exceeds the upper Bollinger Band.
- RSI rises above 70 (indicating overbought conditions).
Stop Losses
Buy Trades:
- Slightly below the low point where the price touched the lower Bollinger Band.
Sell Trades:
- Slightly above the high point where the price touched the upper Bollinger Band.
Take Profits
Buy Trades:
- Price touches the middle Bollinger Band line or
- RSI rises towards 50-60, indicating diminishing bearish momentum.
Sell Trades:
- Price touches the middle Bollinger Band line or
- RSI drops towards 40-50, showing fading bullish momentum.
How/Why the Strategy Works
Bollinger Bands measure an asset's volatility. The outer bands expand during high volatility and contract during low volatility. The asset prices tend to revert to the mean, so a touch or breach of an outer band often indicates a short-term price extreme.
On the other hand, the RSI measures the magnitude and persistence of price movements. Values below 30 or above 70 denote oversold or overbought conditions, respectively.
By combining these tools, traders get a two-fold verification system. The Bollinger Bands hint at price extremes through volatility, while the RSI confirms it through momentum. This dual filter helps in improving the strategy's reliability, capturing reversals with a higher degree of accuracy.
2. Moving Average Crossover with MACD Confirmation
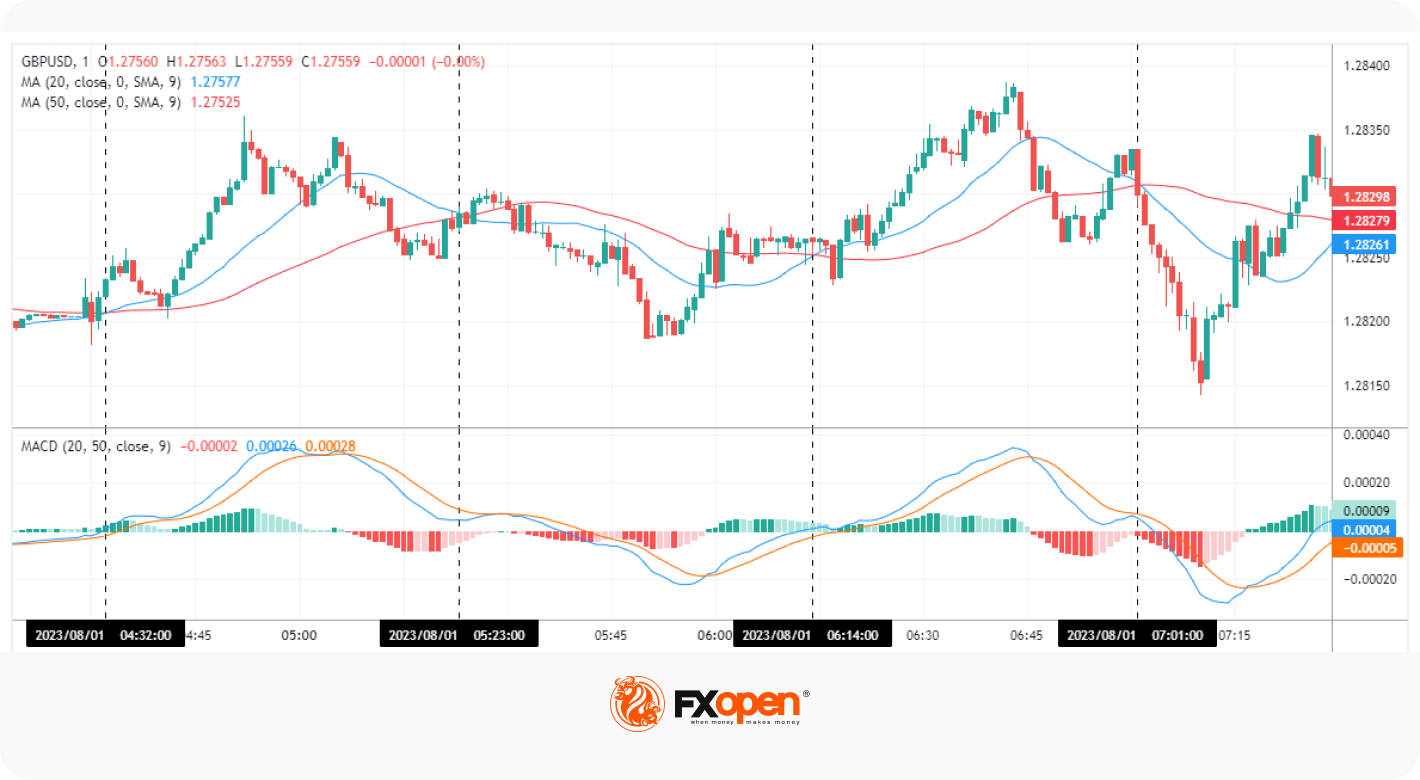
Combining the simplicity of Moving Averages (MA) with the insights from the Moving Average Convergence Divergence (MACD), this is one of the day trading strategies. When the two MAs crossover, it indicates a potential change in trend. The MACD serves as a filter to ensure the trend has momentum and is not a false signal. It’s a good idea to set the MACD’s fast and slow lengths to the same as your Fast and Slow MAs.
Entry/Exit Criteria
Entries
Bullish Entry:
- Fast MA (e.g., 20-period, blue in chart) crosses above the Slow MA (e.g., 50-period, red in chart).
- MACD line moves above the signal line.
Bearish Entry:
- Fast MA crosses below the Slow MA.
- MACD line moves below the signal line.
Stop Losses
Stop Loss for Bullish Entry:
- Slightly below the Slow MA at the point where the Fast MA crossed above the Slow MA.
Stop Loss for Bearish Entry:
- Slightly above the Slow MA at the point where the Fast MA crossed below the Slow MA.
Take Profits
Bullish Trades:
- Fast MA crosses below the Slow MA or
- MACD line descends below the signal line.
Bearish Trades:
- Fast MA crosses above the Slow MA or
- MACD line ascends above the signal line.
Why/How the Strategy Works
Moving Average crossovers indicate trend shifts. If the fast MA surpasses the slow MA, it implies rising momentum; if it drops below, it indicates a potential decline. However, these signals can be misleading. The MACD, reflecting the relationship between two MAs, validates momentum. A MACD line crossing its signal line confirms the MA's direction.
3. Fibonacci Retracement with Stochastic Oscillator

Marrying the predictive power of Fibonacci retracements with the momentum sensitivity of the Stochastic oscillator, this strategy aims to identify potential reversals within major trends. Fibonacci retracements are horizontal lines that indicate potential support and resistance levels, while the Stochastic oscillator measures the speed and change of price movements.
Entry/Exit Criteria
Entries
Bullish Reversal:
- Price retraces to a significant Fibonacci level (commonly 38.2%, 50%, or 61.8%).
- The Stochastic oscillator goes below 20 (oversold territory) and then crosses back above, indicating gaining bullish momentum.
Bearish Reversal:
- Price retraces to a major Fibonacci level.
- The Stochastic oscillator exceeds 80 (overbought territory) and then crosses back below, signalling growing bearish momentum.
Stop Losses
Stop Loss for Bullish Reversal:
- Slightly below the Fibonacci level where the entry was made.
Stop Loss for Bearish Reversal:
- Slightly above the Fibonacci level where the entry occurred.
Take Profits
Exit for Bullish Trades:
- Price reaches the next Fibonacci resistance level or
- The Stochastic oscillator surpasses 80.
Exit for Bearish Trades:
- Price hits the next Fibonacci support level or
- The Stochastic oscillator drops below 20.
Why/How the Strategy Works
Fibonacci retracement levels are grounded in the belief that markets often retrace a predictable portion of a move. When prices pull back to these levels, they often find support or resistance, creating potential trading opportunities.
However, solely relying on Fibonacci can lead to false signals. To mitigate this, the Stochastic oscillator is employed. By determining if an asset is overbought or oversold relative to its recent price action, the oscillator adds a layer of momentum-based confirmation.
4. VWAP and Moving Average Confluence
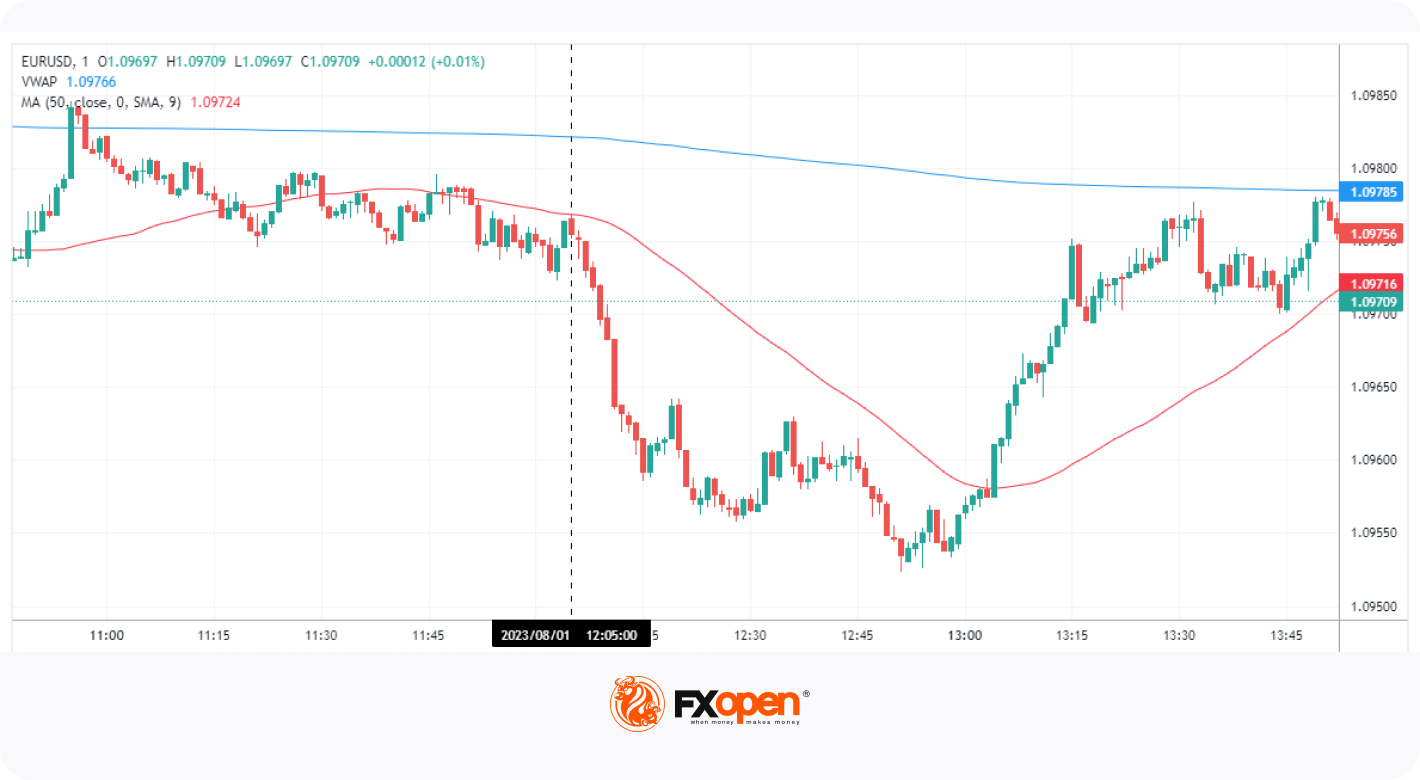
The Volume Weighted Average Price (VWAP) is a trading benchmark used by traders to determine the average price an asset has traded throughout the day based on both volume and price. When combined with a simple moving average (SMA), traders can pinpoint high-probability trade entries based on confluence and deviations. It’s one of the preferred day trading stock strategies.
Entry/Exit Criteria
Entries
Bullish Entry:
- Price is above both the VWAP (blue in chart) and the chosen SMA (e.g., 20-period, red in chart).
- A pullback occurs, where the price tests the SMA without closing below it.
Bearish Entry:
- The Price is below both the VWAP and the chosen SMA.
- A pullback occurs, where the price tests the SMA without closing above it.
Stop Losses
Stop Loss for Bullish Entry:
- Slightly below the entry point.
Stop Loss for Bearish Entry:
- Just above the entry point.
Take Profits
Exit for Bullish Trades:
- Price crosses below the VWAP or SMA.
- A predetermined risk-reward ratio is reached.
Exit for Bearish Trades:
- Price crosses above the VWAP or SMA.
- A predetermined risk-reward ratio is achieved.
Why/How the Strategy Works
The VWAP adjusts the day's price action for volume, indicating an average price. If the price is above the VWAP, it's seen as bullish, and the opposite for bearish. Paired with the SMA, it reinforces trend identification. When both align and serve as support/resistance, they signal market sentiment. By waiting for the price to respect both the VWAP and SMA during pullbacks, traders can achieve a higher probability of successful trade outcomes.
The Bottom Line
Whether trading forex, commodities, or stocks, these day trading strategies can help you find your feet and get started in the markets. Still, you should remember that they don’t guarantee 100% success. Markets are dynamic, therefore, each strategy should be used as a model that transforms depending on market conditions and your trading approach. Once you’ve got some experience under your belt, consider opening an FXOpen account. When you do, you’ll gain access to a broad range of markets to put your skills to the test, while benefiting from lightning-fast execution and competitive trading costs. Good luck!
This article represents the opinion of the Companies operating under the FXOpen brand only. It is not to be construed as an offer, solicitation, or recommendation with respect to products and services provided by the Companies operating under the FXOpen brand, nor is it to be considered financial advice.
Stay ahead of the market!
Subscribe now to our mailing list and receive the latest market news and insights delivered directly to your inbox.


Latest articles

Dow Jones (DJIA): Consolidation Beyond the Trend
Federal Reserve Chair Kevin Warsh testified before Congress on 14–15 July, reaffirming the Fed's commitment to bringing inflation back to target while providing no clear guidance on the future path of interest rates. Meanwhile, June inflation data came in

European Currencies Strengthen Ahead of Key Macroeconomic Releases
EUR/USD and GBP/USD continue to recover moderately following the recent weakening of the US dollar. European currencies have been supported by expectations that US inflationary pressures will continue to ease after softer-than-expected CPI and PPI data, reinforcing market

Brent Crude Oil: From Ceasefire to Crossfire — What's Next?
Just weeks ago, traders were pricing in peace. Now they're pricing in war again—and that reversal says everything about how fragile the current Middle East calm really is.
Brent crude has surged to $86 a barrel, its highest level